Commodity Channel Index, or CCI, is a momentum oscillator that relates the current price to an average price over a given period of time. So the indicator will be high when prices are far above the average and low when prices are far below the average.
—————
FREE Online Course: Jason Leavitt’s Mini Masterclass in Trading
—————
The indicator tends to roll up and down with the 0 line being the center of the range, but it can also stick at a high or low level when the market trends. A constant is used in the calculation to ensure 70-80% of the values fall between -100 and +100, but shorter time frames will have more values outside this range while longer lookback periods will have higher percentage of values within range. It was originally developed for commodities (hence the name) but can be applied to stocks and ETFs.
Here are a couple charts to illustrate before we get into how the indicator can be used.
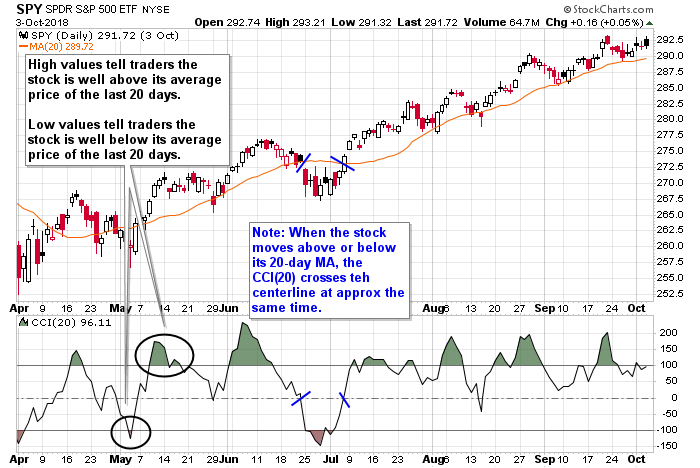
Here’s SPY, an S&P 500 ETF, with CCI(20). High values tell traders the stock is well above the average price of the last 20 days while low values tell traders the stock is well below. Note when the stock moves above or below its 20-day MA, the CCI(20) crosses the center line at approx. the same time. So if the indicator moves to overbought territory, drops to touch its center line and then bounces, it would suggest an up-trending stock dips to the moving average in question and then bounces – a classic dip within an uptrend.
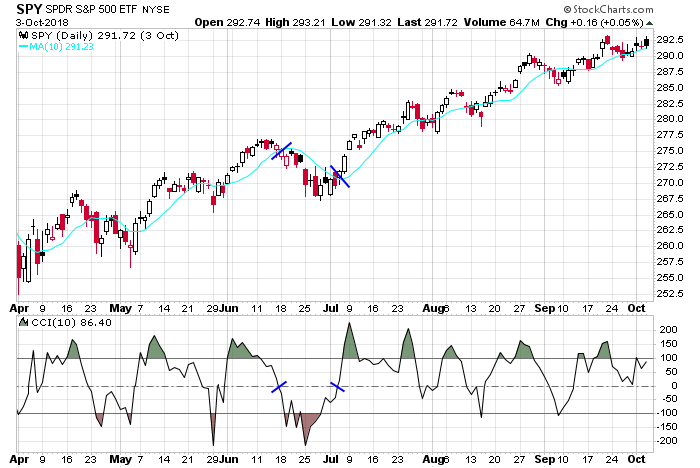
Here’s the same SPY chart with CCI(10). Note, with a shorter lookback period, the indicator is much more jumpy, quickly spiking in both directions and rarely staying at a level for long. Also note the crossing of the center line nearly at the same time the stock crosses its 10-day MA.
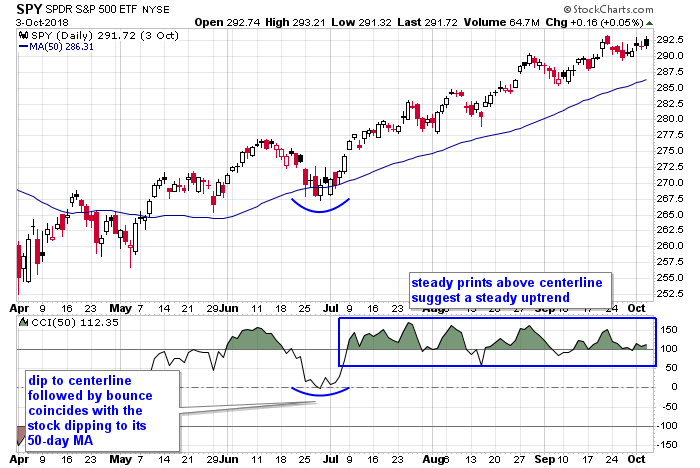
And here’s the same chart with CCI(50). Note it’s much steadier and smoother. The late-June pullback to the 50-day MA coincided with the CCI dipping to its center line – classic dip within an uptrend. And the steady CCI prints July – September suggest a steady trend, which is exactly what was in place.
Trend Identification
Surges above 100 suggest a strong stock that is far above its average price. While there could be some “backing and filling” to allow the underlying to digest its gains, it’s thought such a high value is a sign of strength and a likelihood an uptrend will start or continue. Then, continued prints above the center line tell traders the price is above its average price, and as long as this persists the trend ought to continue.
Likewise, plunges below 100 suggest a stock is weak and far below its average price. And while there could be a reversion to the mean in the near term, the interpretation is that a downtrend is underway. Continued prints below the center line tell traders the price is below its average, so the trend is likely to continue.
The goal of any swing trader is to hold trending positions for many months. Dips within uptrends can be used to initiate positions or add to existing ones. For this, CCI, with an appropriate lookback period, is great. It will keep traders in as long as possible and warn of potential trend changes.
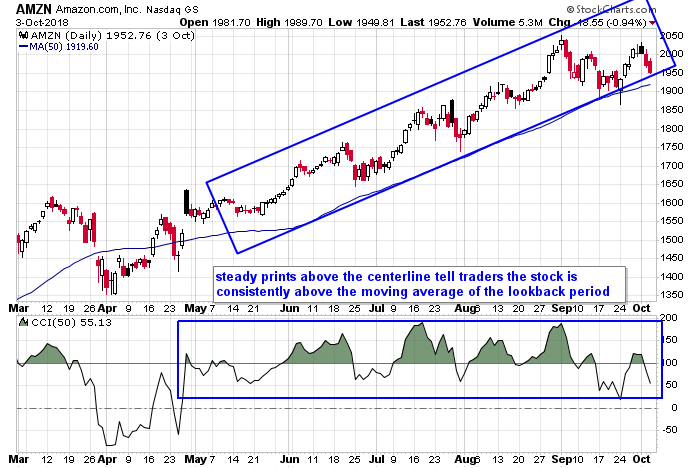
AMZN chopped around its 50-day moving average in April and was matched by its CCI(50) moving above and below its center line. But once the stock established itself above the moving average, the CCI fluctuated well-above 0. This confirmed the trend and gave traders the green light to hold a long position and/or buy dips.
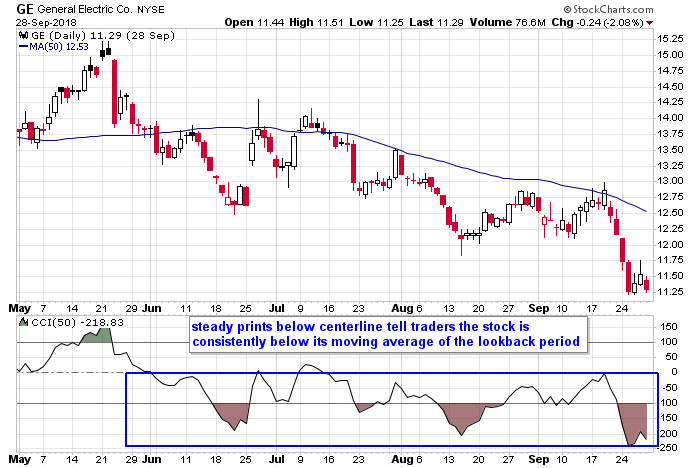
GE broke below its 50-day MA in early June, and its CCI(50) dropped below its center line. As long as the indicator remained below 0, which it did, other than a couple short-lived pops, it would be mathematically impossible for the stock to move up. It can’t. If the price is always below the average, the stock can only mean revert for short periods, but it can’t trend up.
Dips From Overbought Territory/Bouncers From Oversold Territory
CCI is an unbound oscillator. Although it tends to roll up and down, it doesn’t have to. Theoretically there are no upside or downside boundaries, so the concept of overbought and oversold can’t easily be quantified. Overbought securities that are trending can stay overbought for a long time, and oversold securities can remain oversold.
It would not be wise to believe +100 or +150 (-100 or -150) are overbought (oversold). So the indicator should not be used in a vacuum. Instead, looking at the indicator levels relative to previous levels is helpful identifying when a security is overbought or oversold compared to previous activity. Also, using it in conjunction with other indicators or with support and resistance levels on a price chart would significantly increase the odds of success.
Given this, since trading in the direction of the prevailing trend is the MO of most traders (and for good reasons), the CCI can be used to help identify entries after a stock has fallen out of overbought territory or after a stock has bounced from an oversold level.
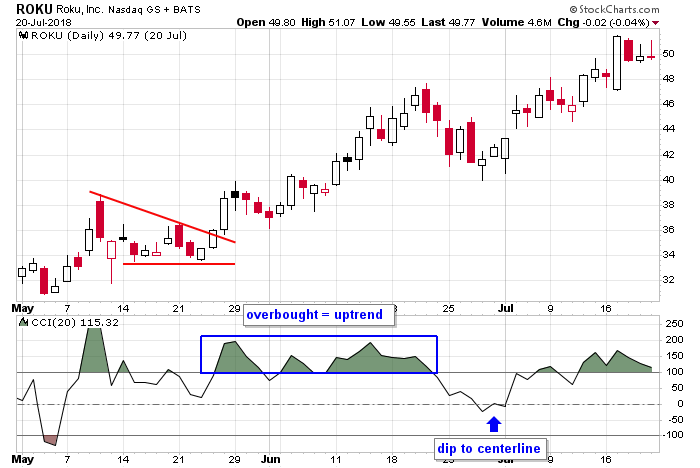
ROKU paused in mid May and then trended up into the mid-40’s. Trend traders who wished to “buy a dip within an uptrend” were given the a-okay when the CCI(20) dipped back to its center line and then bounced. The uptrend continued, and the indicator got back into overbought territory and stayed there.
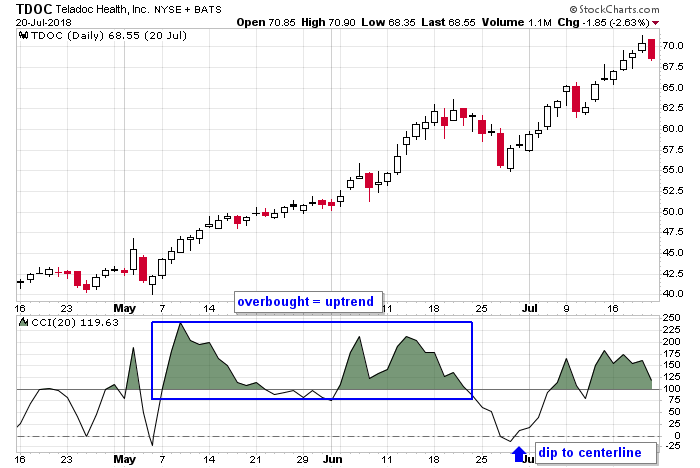
TDOC steadily trended up into its June high. With no noticeable dips along the way, jumping on board was very hard. But when the CCI(20) fell out of overbought territory and dropped to its center line at 0 and then curled up, a signal was given to get long. It’s a classic dip within an uptrend. And if it can be combined with a trendline on the price chart being taken out, even better.
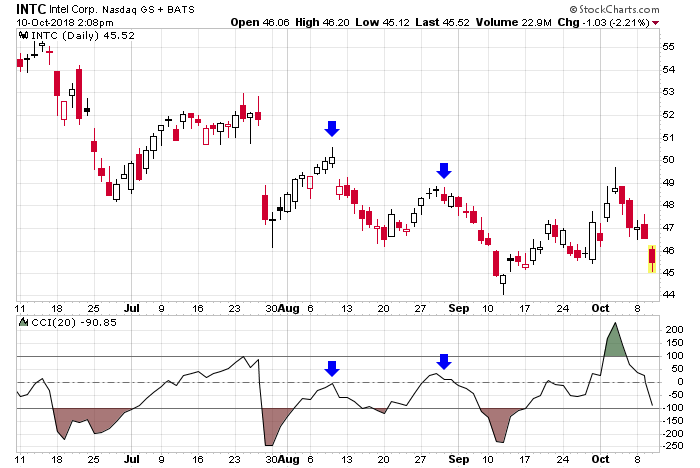
INTC was in the midst of a downtrend. For traders who have to skills and temperament to go short, twice the CCI(20) identified the end of a “bounce within a downtrend” by moving up to its center line and then rolling over. This simply meant the stock rallied approx to its 20-day MA and then got rejected. In the first instance, the second week of August, the entry was tough because the move started with a gap down. But the late-August instance as playable with a short for a continuation of the downtrend.
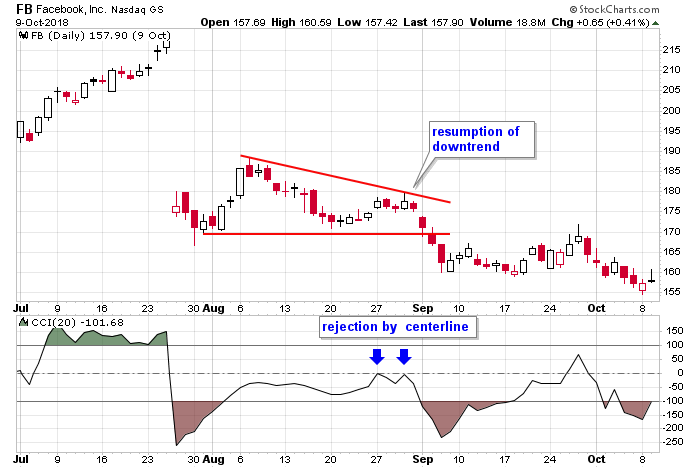
Facebook got crushed in July. After 5-6 weeks of range-bound movement, the CCI(20) moved up to its center line and then rolled over and headed south. Right on cue, FB took out a mini support level at 175 and then 170 and continued down.
Divergences
Divergences with unbound indicators have less meaning than those from bound indicators, but they can still signal declining momentum. If a stock runs away from its moving average during a rally but then runs away from the moving average by a smaller amount during a subsequent rally, traders are told the second rally had less energy, so the odds of a reversal increase.
But like other unbound indicators, false signals are the norm during steady trends. The CCI can stay overbought for long periods and many false divergences form. These should mostly be ignored. Context is needed. They are most useful in gently rolling market or with successive moves separated by minimal time.
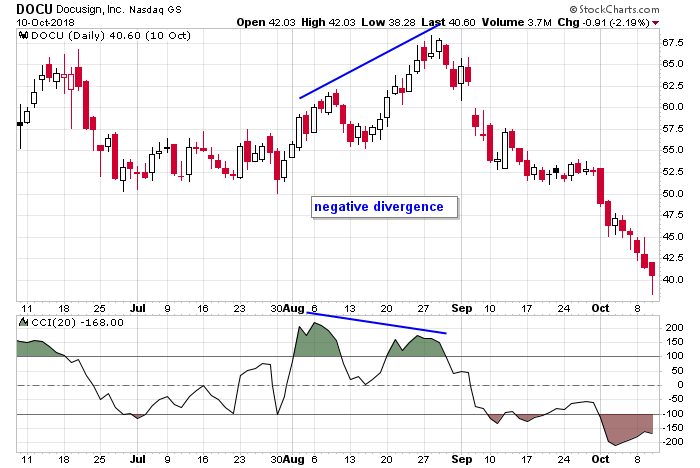
The momentum that built on DOCU’s early-August rally could not be matched by the mid-August rally. The stock pushed up, but the CCI(20) put in an obvious lower high. This told traders there was less energy and momentum behind the move, and while a reversal is never guaranteed, it did increase the odds the rally wouldn’t go too far.
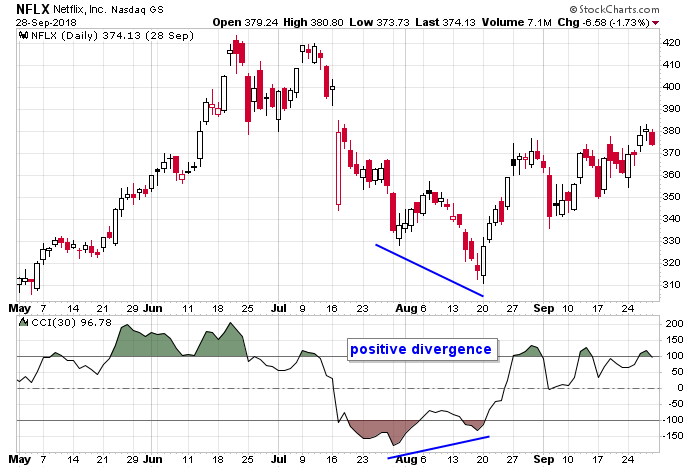
Overall NFLX was trending up, so while the July/August correction looks extreme on this chart, it was only a pullback to the 200-day MA within a long uptrend. The stock made three successive lows in July and August and formed a positive divergence with its CCI(30) on the third plunge. This told traders downside momentum was waning, and there were legit odds a bottom was in place.
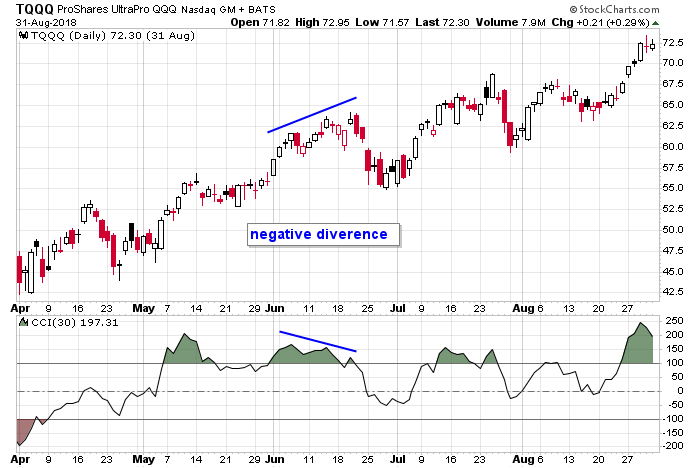
Here’s an example of a negative divergence that formed is a relatively short period of time as the stock, in this case the “triple Q’s,” grinded higher. Each successive move up saw the CCI(30) drop further until there was too much internal negative pressure that needed to be unwound. The stock dropped, but the overall trend, which was solidly up, reasserted itself within two weeks. The divergence warned longs a pullback was likely and gave shorts a quick trade.
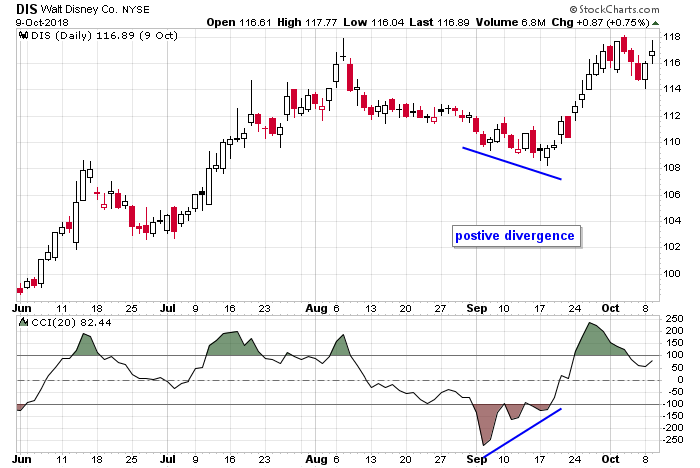
DIS has rallied about 20% off its spring lows when it grinded down in August and September. As the stock put in successive lows, the CCI(20) put in higher lows, producing a positive divergence with the price action. A tradeable bounce followed.
CCI can be used on multiple time frames and for multiple lookback periods. Traders are encourage to tinker around and see what’s most appropriate for each stock they trade. Stocks have personalities. A CCI(10) may be best for one stock while a CCI(20) is best for another.
Shorter Term Trends Within Longer Term Trends
It’s fairly common for traders to establish a bias with a long term trend and then look for entries from the shorter term ups and down with that trend. This could mean getting a bias from a daily chart but getting an entry from an hourly. It could mean getting a bias from a longer term indicator and then using a shorter term indicator for entries. In the case of the CCI, it means getting a bias from a longer term parameter and then using a shorter term parameter to time entries.
For example, CCI(50) could be used to identify a longer term trend, and then CCI(20) could be used to time entries within the trend. Let’s look at a couple examples.
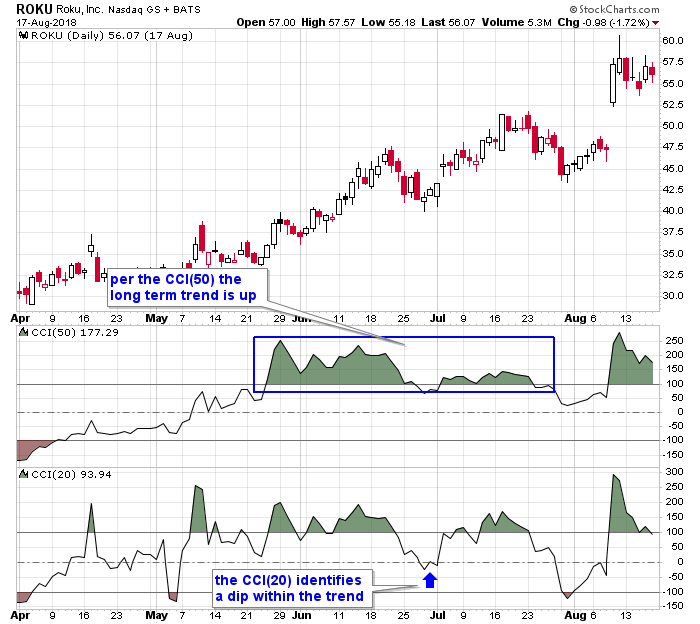
ROKU steadily trended up for several months the spring and summer of 2018. The CCI(50) identified the trend. As long as the indicator was above or close to 100, traders were told the trend was steady and not in jeopardy of ending. While this was taking place, the CCI(20) rotated down to its center line in late June. This was essentially a “dip within an uptrend.” The longer term CCI told us the trend was up; the shorter term CCI helped identify a dip within that trend.
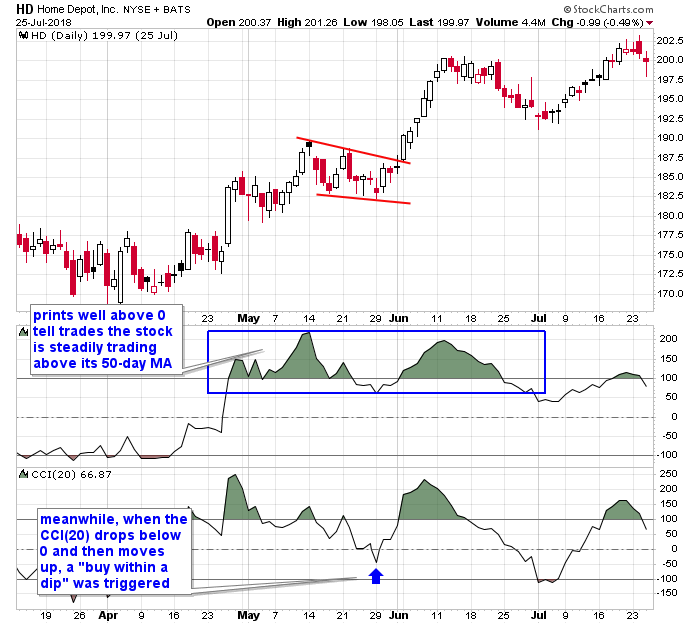
HD rallied off its April low and then consolidated the second half of May. While the CCI(50) stayed above 100, while only dipping below the level by a small amount, the CCI(20) rotated down to 0 and then bounced. This is a classic dip within an uptrend. The CCI(50) identified the trend while the CCI(20) identified the dip.
This write-up is a work in progress. More examples will be posted. Join our email list. Be alerted of new content.