Bollinger Bands, developed and trademarked by John Bollinger, are bands placed above and below a moving average. They are based on standard deviation, which is a measure of volatility, so when volatility increases, the bands widen to accommodate the price action, and when volatility dampens, the bands narrow.
—————
FREE Online Course: Jason Leavitt’s Mini Masterclass in Trading
—————
The entire indicator is plotted as three bands: a middle band (moving average) and an upper and lower band a specified standard deviation away from the middle band. The default setting in most charting platforms is to use a 20-period moving average for the middle band and a standard deviation = 2. This standard deviation ensures approx. 90% of the data points will fall between the bands. Other settings can be used.
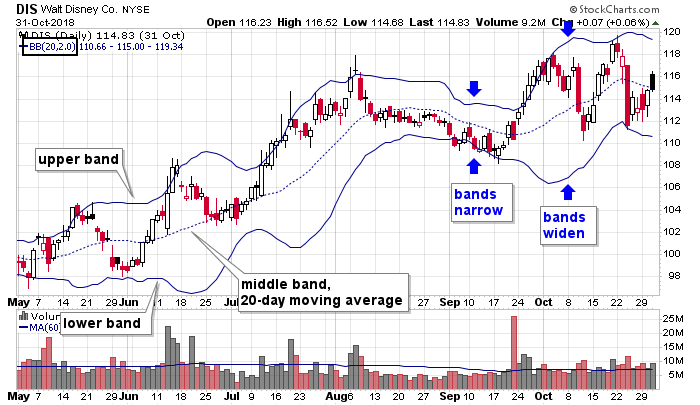
Here’s DIS with a 20,2 Bollinger Band. This means the center band is the 20-day moving average, and the upper and lower bands are 2 standard deviations from the center. Other than immediately after a sudden move, most of the data points fall within the bands. Also note how the bands self-adjust. During quiet periods, such as the last three weeks of August, the bands narrow, but during higher volatility periods, such as late September, the bands widen.
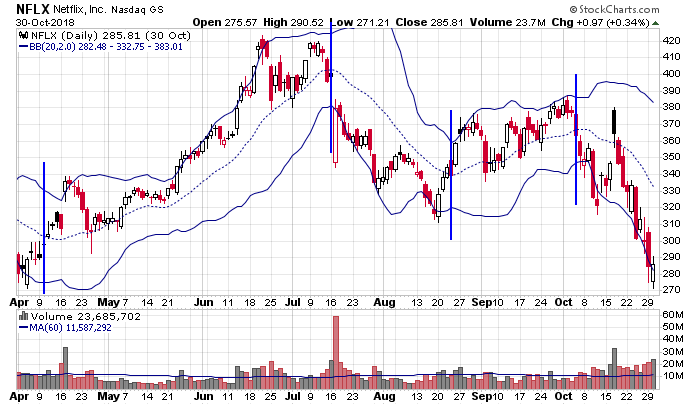
NFLX is not a smooth-moving stock. It can be quiet and jumpy. It can sit tight in a range and then suddenly surge. But notice how the Bollinger Bands capture a bulk of the movement. The stock trended up mid-April – mid-July, while bouncing back and forth between the center band and upper band. Then it trended down, while staying between the center band and lower band. Then it again moved in the upper half, which was followed by another period in the lower half. The bands are self-adjusting and will contain most of the movement. If you can determine which side the stock is on and likely to stay, you have a bias to work with.
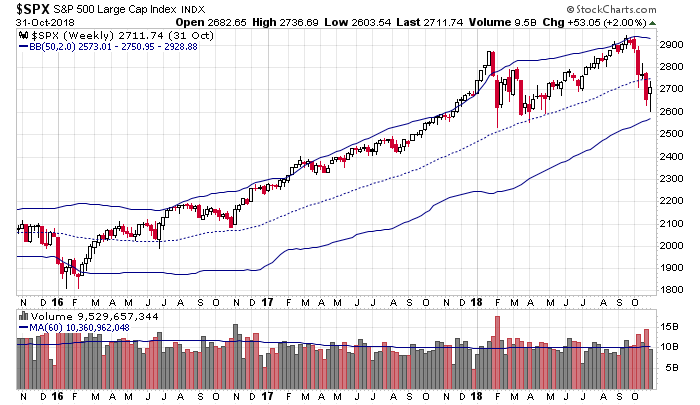
Here’s the S&P 500 weekly with 50,2 parameters, so the 50-week MA is used as the center band. Within a trend, the index stayed in the upper half of the bands, and each test of the center band was a buying opportunity on a shorter time frame chart. Until it wasn’t in October 2018.
The use of Bollinger Bands varies within the trader community. There are numerous books devoted to this indicator alone, including one by Bollinger himself. This isn’t meant to be a “everything there is to know” write-up. Instead it should serve as a good overview that offers many examples and an overall launching point for further study. Uses include, but are not limited to, the following.
W Bottoms
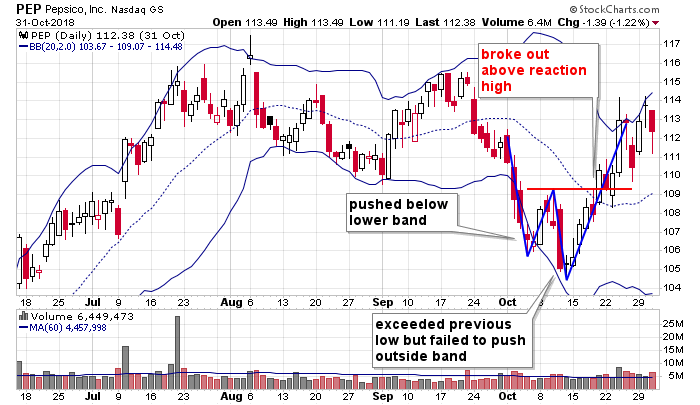
W Bottoms are a type of a double bottom. They form within downtrends and are characterized by two distinct lows, where second low is slightly lower than the first but remains within the bands. Often the first move down falls below the lower band while the second stays above. The inability of the second drop to take out the band is a warning the downside momentum and energy are waning. Traders can then zoom in with an intraday chart to look for a long entry. Then a rally follows, and a reversal is confirmed when the high between the two lows is taken out.
PEP moved down from 115 to 105, put in a double bottom W pattern and then rallied. The first reaction low took out the lower band, but the second, despite dropping to a lower low, did not. Once the reaction high between the two troughs was taken out, a new uptrend began.
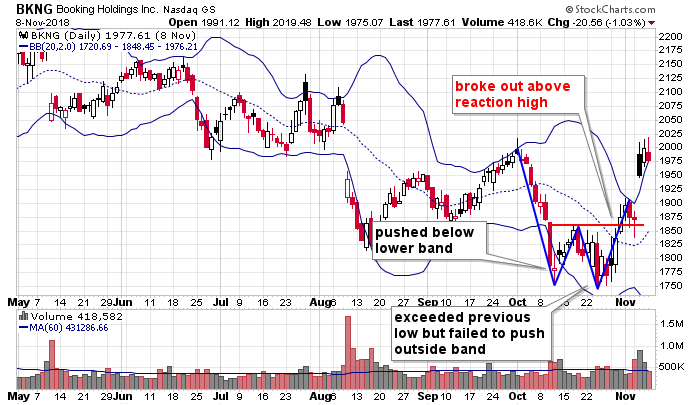
BKNG fell from its upper band through its lower band. Then, after bouncing, it moved down again but failed to take out the lower band, despite falling below its previous low. This was a sign the the tide may be turning. There are no guarantees, but traders can zoom in with an intraday chart to look for an entry off the second low of the W.
M Tops
M Tops are a type of a double top. They form within uptrends and are characterized by two distinct highs, where second high is slightly higher than the first but remains within the bands. Often the first move up takes out the upper band while the second stays below. The inability of the second rally to take out the band is a warning the upside momentum and energy are waning. Then a correction follows, and a reversal is confirmed when the low between the two highs is taken out.
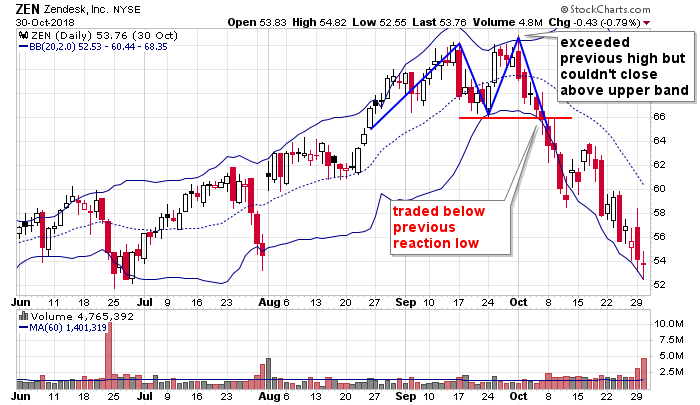
ZEN trended up in sloppy fashion and then formed an M Top and headed south. The first hump and subsequent drop to the lower band were normal movement for a semi volatile stock within an uptrend. But the slight higher high on the following rally attempt and inability of the stock to close outside the upper band was a warning momentum was waning. Skilled short term trades can zoom in and look for a short entry for a trade back to the lower band. And then when the low between the two humps was taken out and the lower band was pushed down, the uptrend was officially over and a downtrend was underway.
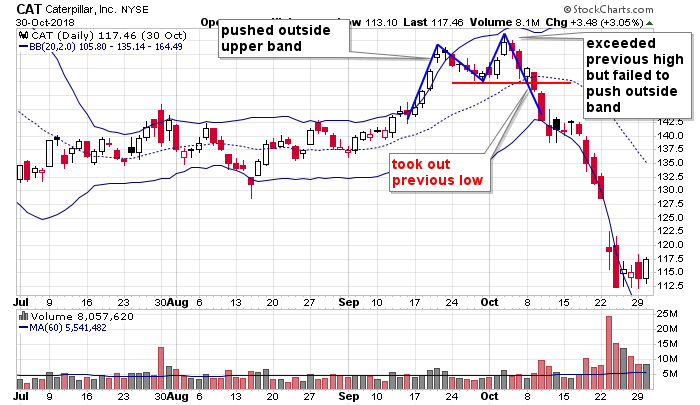
CAT traded flat for a couple months and then popped in September. The first surge came with a move outside the stock’s upper Bollinger Band, but after a reaction low, despite a higher high, the subsequent move up was contained by the upper band. When the stock took out the reaction low, the uptrend ended and a new downtrend began.
Reversals
When price travels outside the upper or lower band and then closes within bands, take a position going in the opposite direction. Odds are this won’t be a long term trade, but a move back to the center band is likely. But this is a short term trade only. Given the press against the outer band, a trader cannot expect the stock to do anything other than reverse in the near term. Also, it preferable to not fight a trend, so look for opportunities with flat stocks and keep counter trend trades short term.
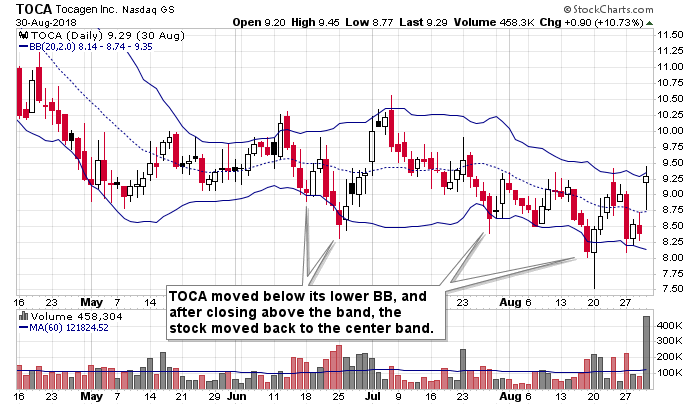
TOCA was a flat-to-slightly-down-sloping stock. Several times it dropped below its lower Bollinger Band, and each time the stock closed above the band, a move back to the moving average followed. With a calm stock that lacks direction, playing “ping pong” between the bands can be very profitable. Just don’t overstay your welcome; you’re only looking for short term counter trades.
MSFT was trending up when it dropped to its lower Bollinger Bands. Unless there’s something seriously wrong with the stock, this can be considered a pullback within an uptrend. After closing below its lower band, a signal to get long was given when the stock closed within the bands. It took two attempts, but then the stock moved back to its moving average and beyond.
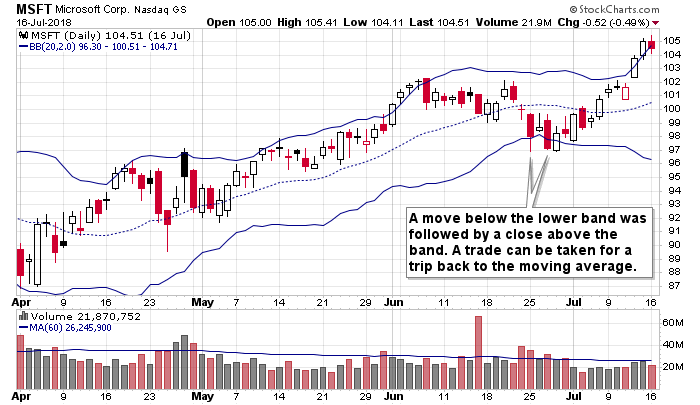
Within a Trend, Enter on Reactions Back to the Center Band, and then Use the Outer Bands as Price Targets.
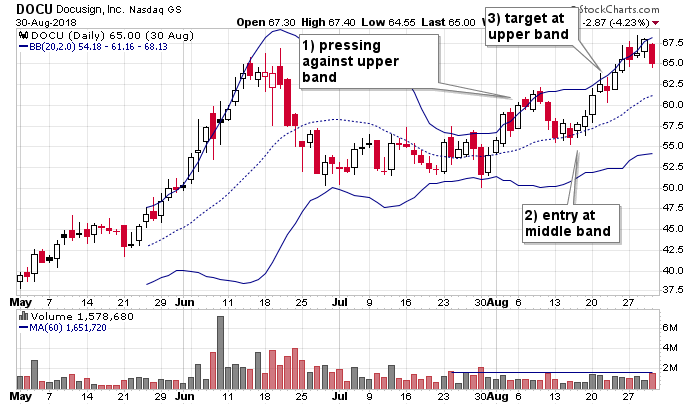
Specifically, within an uptrend, price tends to trade back and forth between the middle band and the upper band, all while the stock has an upward slant to it. Buy dips to the center line and take profits at the upper band. Likewise, within a downtrend, price tends to trade back and forth between the middle band and lower band, all while the stock has a downward slope to it. Short rallies to the center line and take profits at the lower band. These setups are especially useful when price has touched the outer band before returning to the center band for an entry.
After pressing against the upper Bollinger Band in early August, DOCU returned to the middle band mid-month. Within a newly formed uptrend, this gives a general area the stock can be purchased for a trade back up to the upper band.
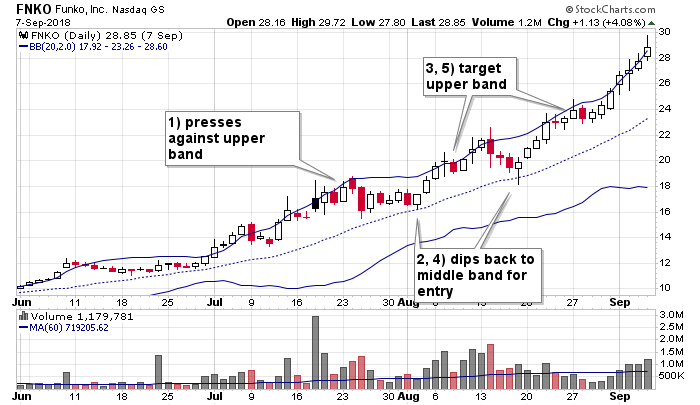
FNKO pressed up against its upper band the first half of July. It then dipped back to its middle band (the 20-day moving average) for an entry before legging up to the upper band again. The process repeated in August. The ability to press against the upper band is a sign of strength and clues traders in a dip is likely to get bought.
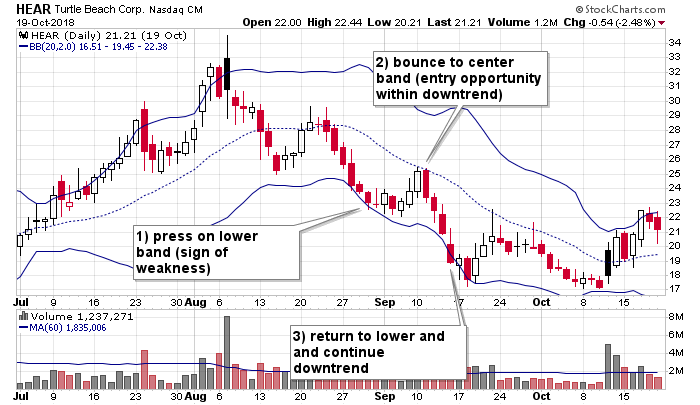
HEAR broke its uptrend in mid-August by taking out its center band and then failing to recapture it on the following bounce. When a lower low was put in a place, a downtrend was forming. The stock then pressed against its lower band at the end of August and followed it with a bounce to the 20-day moving average. This was a short entry area. The stock then rotated back down until it pressed on the lower band again.
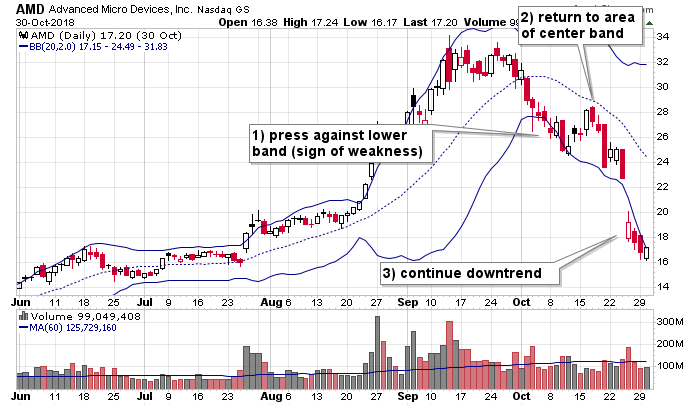
AMD was one of the market’s strongest stocks the first nine months of 2018, but when it fell and pressed against its lower band in early October, a message was sent the good times were over. The bounce to the moving average in mid-October offered a short entry to play a continuation of the newly formed downtrend.
Within a Trend, Dips to Opposite Band Can Also Present Good Buying Opportunities.
These would be considered slightly bigger dips within a trend and offer a frame of reference. Stocks that rally for several years, will drop to their lower bands numerous times without destroying the long term prospects.
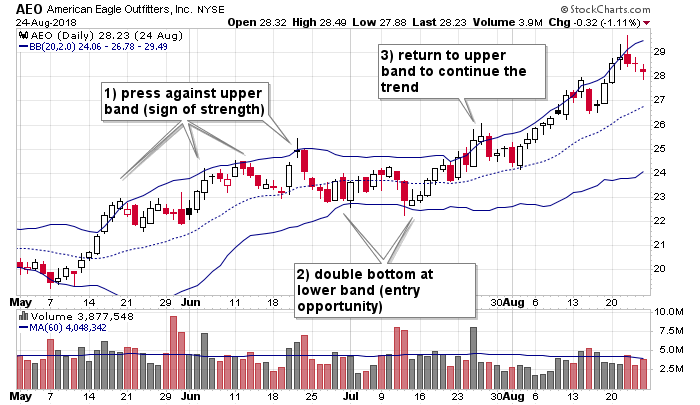
AEO rallied from 20 to 25, dropped and did a double bottom on its lower band, and then continued up. The drop was nothing more than a relatively minor pullback within an established uptrend.
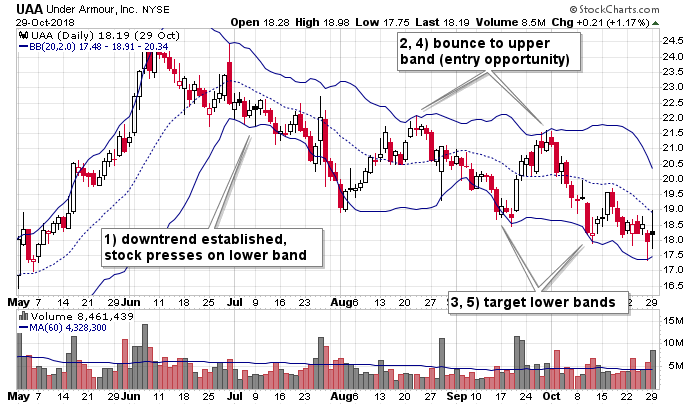
UAA dropped off its high and pressed down on its lower band for an entire month. This told trades the pullback was not just a pullback within an uptrend, but was the beginning of a downtrend. The subsequent bounce to the upper band in August offered traders a chance to go short for a trip back to the lower band. Another opportunity was given in late September.
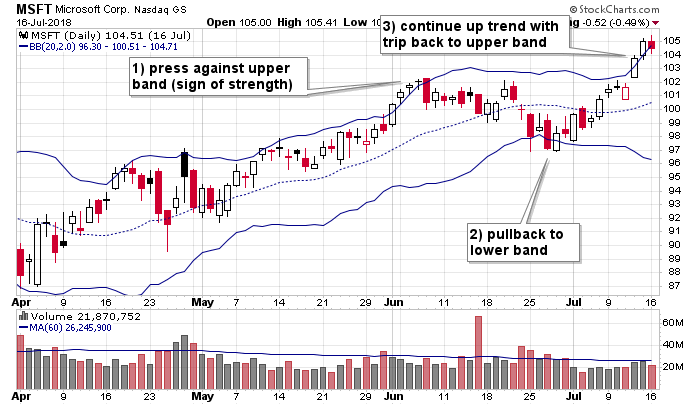
MSFT was a strong stock within an uptrend when it pulled back and based in the area of its lower band. This was a buying opportunity for traders who like buying dips within uptrends.
This write-up is a work in progress. More examples will be posted. Join our email list. Be alerted of new content.
3 thoughts on “Bollinger Bands – Everything You Need to Know”
Leave a Reply
You must be logged in to post a comment.
very informative , detailed and thorough thank you .
Great stuff. O have never really understood the Bollinger Bands or how to really use them.
I have been using them in conjunction with the MACD. I seems to suit my trading style.
Reed bryant
An easy to understand lesson about Bollinger Bands