A moving average is an overlay indicator that plots the average price over a given number of periods. It smooths out the data points and hints at a trend on whatever time frame is being viewed.
Moving averages do not predict future prices – nothing can – they simply tell where price has been and the direction it’s moving.
—————
FREE Online Course: Jason Leavitt’s Mini Masterclass in Trading
—————
With easy access to data and computers, there’s no shortage of how data points can be assembled and averaged. But let’s keep things simple and stick with the basics. There is no magic moving average on any time frame chart. One trader may prefer a 50-period moving average on a daily chart while another has found success with a 21-period MA on an hourly chart. There are standards in the industry which are worth watching because so many large entities key off them, but there is no magic here. After consuming this tutorial, traders are encouraged to tinker with multiple moving averages on multiple time frames to see what works best for them.
—————
Join our email list – get technical research reports sent directly to you.
—————
The two most popular moving averages are simple moving average (SMA or MA) and exponential moving average (EMA).
Simple Moving Average
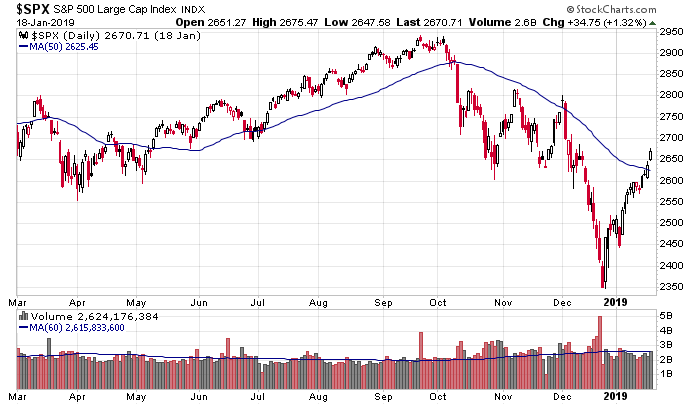
A simple moving average is the average closing price over a specified number of periods. So to calculate a 50-day moving average, add up the closing prices of the last 50 days and divide by 50. That’s a single point on the moving average line. The next day, remove the closing price from 51 days prior and add the new price. When new prices are higher than old prices, the MA will move up. When new prices are lower than old prices, the average will move down. Here’s an example of the daily S&P 500 plotted with a 50-day moving average.
Exponential Moving Average
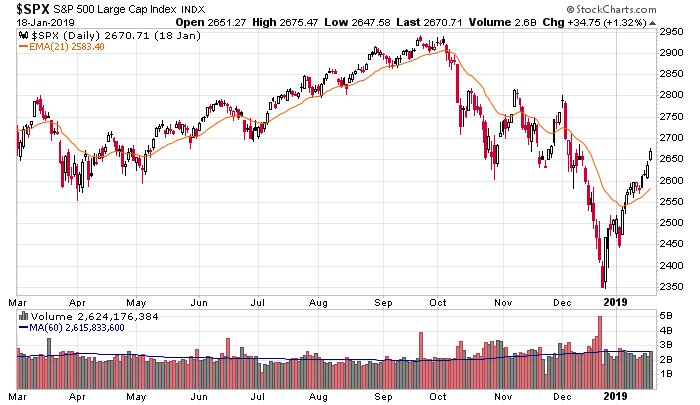
An exponential moving average is similar to a simple moving average, but it weights the most recent data points more, so the average will be slightly more sensitive to price movements – moving up faster in an uptrend or down faster in a downtrend. The other difference is, whereas the SMA calculation only uses the number of data points necessary to cover the time period in question (50-day MA uses 50 days of data), an EMA retains usage of all data points, regardless of the lookback period (50-day EMA uses the data points hundreds of days ago). Because of this, EMAs on different charting platforms may vary slightly because each will have a different starting point. They’ll be close because the most recent data points are weighted more, but they can still be off by a slight amount. The exact calculation is beyond the scope of this write-up. Here’s an example of the daily S&P 500 plotted with a 21-day EMA.
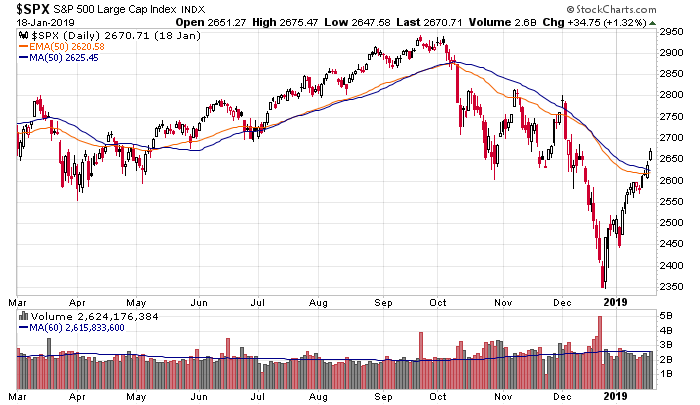
And for comparison, here’s a daily S&P 500 with both a 50-day SMA (blue) and 50-day EMA (orange). Notice when the market dropped in October, the EMA, being more sensitive to recent prices, moved down faster than the SMA.
Random notes before discussing specific strategies
- Sensitivity – Shorter term MAs (10-day vs. 50-day) react quickly to price movement. In a trend, they’ll hug the price chart and reverse quickly when price turns. They’re like small boats that easily stop and travel the opposite direction. Longer term MAs are much slower to react. The underlying can drop 10% over a few weeks and then recover, while the 200-day MA barely deviates from its path. They’re like cruise ships, requiring a lot of time to turn.
- Length – The ideal length, or lookback period, of a moving average needs to be matched up with a trader’s strategy. Traders must mix and match time frames with moving average lengths. For example, a 50-day MA on a daily chart may be too long, but a 50 on an hourly or 15-min chart might be perfect. A 21-period EMA on a 5-min chart may be great for day trading. Traders are encouraged to play around and find a few moving averages on each time frame chart they use.
- Unlike a simple price chart that shows where the underlying has actually traded, a moving average, being an average of many past data points, isn’t a reflection of where a stock has found support or resistance. It can literally be a point in space that hasn’t been tested. Still, whether because it’s a self-fulfilling prophecy or not, they offer levels where something could happen. A quick glance at a chart tells whether a particular MA has relevance. Prior dealings with the MA increases the odds it’ll come into play again while many instances of being out of sync is reason to ignore it for a period.
- Also, given modern software that enables a trader to change the length of a moving average instead of being forced to use a popular default setting, it’s acceptable to tinker with MAs to find ones that are in sync with a particular stock. Stocks walk to the beat of their own drummer. A 21-day MA may work great for one stock while a 34-day MA works best for another. Not only is it acceptable, traders are encouraged, within reason, to back-fit moving averages to stocks. This doesn’t guarantee anything going forward, but it’s certainly better to key on an MA that has been successfully tested instead of a random MA that has had no past relevance. This is one indicator that it’s acceptable to tinker around and back-fit to past data because the ultimate the goal is to find an MA (or two) that seems to be in sync with the underlying.
- It’s also acceptable to use MAs on intraday charts. A 50-period moving average on a 60-min chart or a 21-day MA on a 15-min chart may work great for shorter term traders who look out several days instead of several months.
- Neither the simple nor exponential moving average is better than the other. They’re just lines on charts that reflect previous data points in slightly different ways. No moving average is inherently better than others, and neither is any time frame. But there are moving averages (50- and 200-day MAs) that are closely followed by all big institutions who manage billions of dollars. If they’re watching those levels, you should to.
The following popular uses of moving averages are discussed below. Not all are recommended, but for the sake of completeness, they’re included.
Trend Identification
Price Location Relative to Moving Averages (recommended)
Price Crossovers (not recommended)
Price Kisses – Support and Resistance (recommended)
Moving Average Crossovers (not recommended)
Moving Average Kisses (recommended)
Employing Multiple Strategies on Multiple Time Frames (recommended)
Moving Average Hand Off (watch for this)
Trend Identification
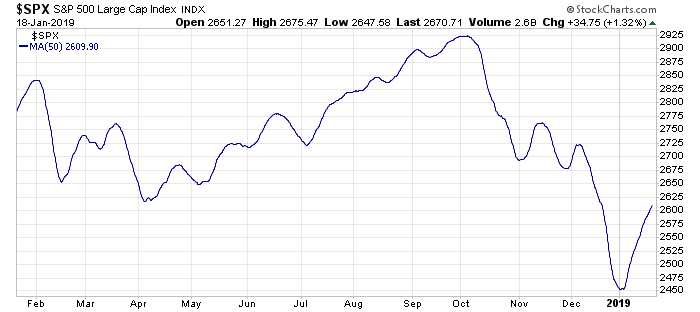
The direction a moving average moves offers quick interpretation of the price chart – are prices generally moving up or down or are they flat over a given lookback period. An up-trending 50-day MA suggests prices are moving up, although there are can be shorter term counter trends within longer term trends. A 50-day moving average can be moving up while a 21-day moving average can move down, suggesting a stock is moving up overall but in the near term is pulling back. Here’s the S&P 500 (invisible) with a 50-day MA. A quick glance at the moving average reveals a lot – is the underlying moving up or down; is it sustaining a trend or chopping around in a range? It’s not a far-fetched leap to assume a trader who goes long only when this MA is moving up would do better than a trader who went long at any random time. Using the moving average as a filter like this would reduce the number of days one is active while likely increasing profits.
Price Location Relative to Moving Averages
Many large institutions filter their investments based on where a stock is relative to a moving average. For example, many won’t buy a stock unless it’s above its 200-day moving average. It’s true that trends are a real phenomenon in the market. A stock that is healthy and trending up is much more likely to produce gains than a stock which is trading flat or down. At any given time, a small percentage of stocks do very well while a large percentage just bounce around and don’t move much. It’s better to be concentrated in stocks that are moving than stocks that are dead money. Hence why many large entities will restrict their operations with regards to where a stock is relative to a certain MA. In fact legendary trader Paul Tudor Jones suggests only buying stocks that are above their 200-day MAs. By restricting himself in this way – essentially waiting until a stock has proven itself – he avoids many laggards that would either cost money or time. Given whatever time frame you trade, it’s not a bad idea to establish a similar rule – only buy a stock that is above a certain moving average. It’s a good filter to start with. This isn’t a trading strategy per se. It’s a “green light, red light” overlay. When price is above, a trader has the green light to funnel a stock through his strategy and look for a trade. But when price is below, a red light is on, so a trader should look elsewhere. There are thousands of stocks to consider. This filter would narrow a list to more workable number.
Price Crossovers
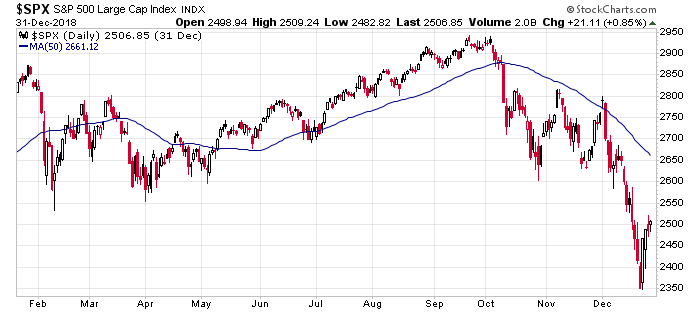
A price crossover is when the price of the underlying crosses through a moving average. A cross up is bullish; a cross down is bearish. In hindsight, price crossovers in a trending stocks work great. They get you in near the beginning of a move and keep you in until price reverses or flattens out. But in a flat market, a lot of false signals are generated, leading to churning one’s account. In the author’s opinion, by themselves, price crossovers are not a good strategy. They look great in hindsight when matched with a trending move, but in the heat of the battle there’s no way to know if a trend is materializing or if a stock will roll up and down in a range for a long time.
S&P 500. If a trader was long when the S&P daily closed above its 50 and then closed out the position when the index fell below the MA, he would have been chopped up the first half of the year, but then he would have nailed almost the entire May-September rally and then would have sat out nearly the entire 600-point drop. Is it realistic to believe a trader could have nailed the trending move after several false signals? Doubtful. In hindsight this worked well, but it would be hard to execute. What if the index traded in a range for an entire year and didn’t trend at all? One bonus is there is minimal decision-making necessary – all traders could benefit from having a slightly mechanical system as opposed to being overly discretionary.
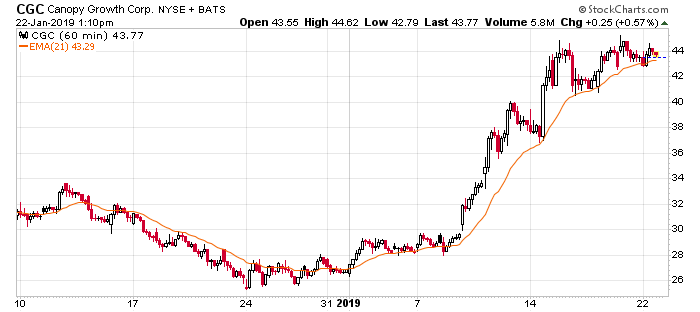
CGC hourly chart with a 21-period EMA. After-the-fact, the moving average supported the stock several times while it ran up from the high 20’s to the mid 40’s, but there were numerous false signals during the three weeks prior to the move. After getting chopped up so badly, it would not have been easy to nail the big trending move…and there was no guarantee the choppiness wouldn’t last another month or two. It seems once a stock starts to move, certain moving averages do a great job acting as support and therefore can be used as a guide, but there are too many false signals to blindly buy or sell closes above or below the lines. This will be talked about in the next section.
Price Kisses – Support and Resistance
Building on price crossovers above, an alternative to blindly buying or selling when the underlying crosses a moving average is to demand a successful test before entering. By requiring the stock to hold or successfully test a moving average, there’ll be many less false signals, and you’ll trade much less often, with higher odds of success.
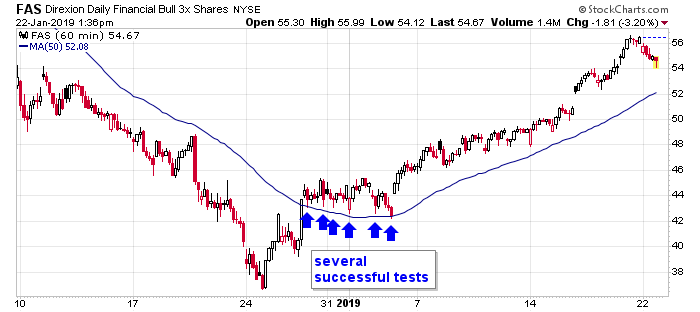
After the underlying crosses a moving average, it’ll often come back and “kiss” the moving average before establishing itself in a trend. For aggressive traders who missed the first entry (maybe they run a scan at the end of the day to find stocks that close above a moving average…so they don’t get a list until after the close) or more conservative traders who demand this type of retest before entering, this offers a second chance. And in the author’s opinion, a better chance.
FAS hourly chart. The stock surged on Dec 27 and closed above its 50-hour MA. But we know a stock can trade above and below a moving average numerous times before starting a move. By waiting until the stock successfully tested the MA, the odds a long trade would be successful were much higher, and a tight stop just below moving average could be used.
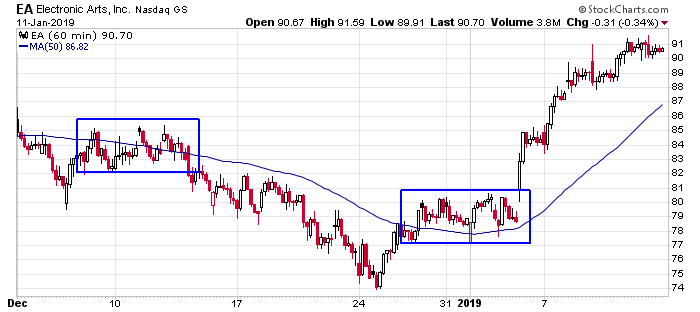
Here’s another example of waiting until a stock establishes itself above a moving average before entering. EA moved above its 50 on the hourly time frame the last week of December. The stock could have chopped around like it did earlier in the month, leading to frustration and a string of losses. But later in the month, by waiting until the moving average was successfully tested, the risk was more clearly defined (a stop could be placed below the MA), and the odds of success were much higher.
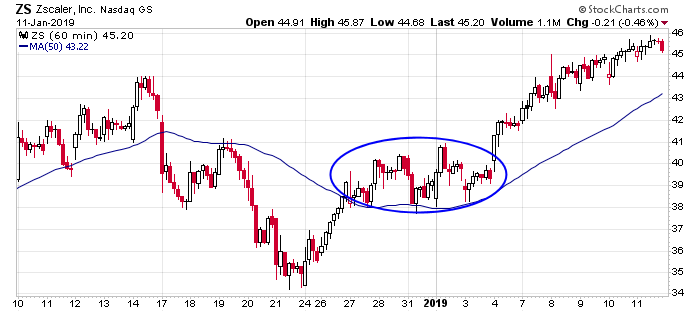
ZS dropped from the mid 40’s to the mid 30’s and then bounced. Buying a close above the 50 on the hourly time fame came with added risk because the stock had just rallied from 34 to 39, and the trend could have still been considered down. But waiting for the stock to establish itself above the moving average provided higher odds of success because the MA proved to be a place buyers were willing to step in.
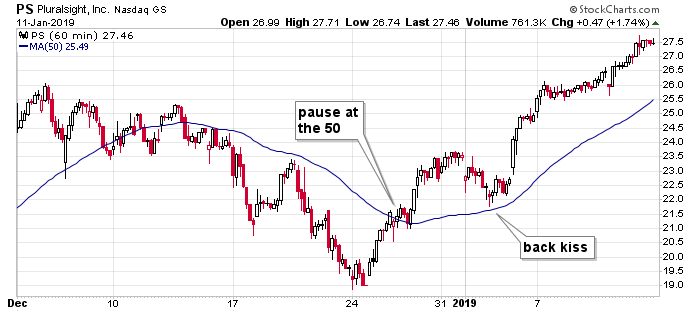
PS put in a series of lower highs and lower lows on its hourly time frame heading into the last week of December. Then the stock bounced and recaptured its 50 MA and sat there for the equivalent of a day. An aggressive trader could buy there with a tight stop, but it would not have been easy. The stock had just rallied 2.5 points (13%) and was still trending down overall. But waiting a week for the stock to come back down and back kiss the moving average, which was then trending up, would have offered higher odds of success. Yes the entry would be at a slightly higher price, but the odds of success would have been much better.
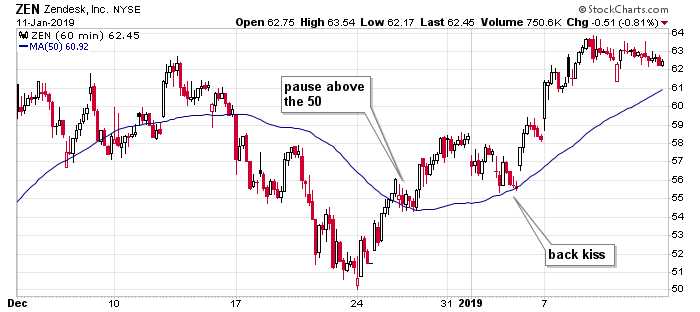
ZEN rallied off a December 24 low, and once it was above its 50 MA on its hourly chart, it sat there to restore its energy. An aggressive trader could have entered there, but waiting a week for the stock to come back and test the moving average was also an entry for those who’d rather be a little late in a better trade.
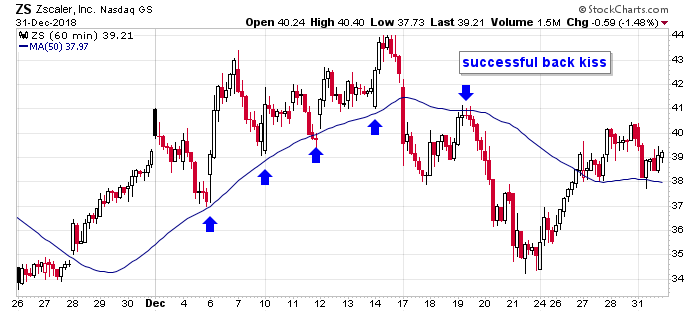
Back kisses also work for shorts. ZS bounced off its 50 on its hourly time frame several times the first two weeks of December. Then it sliced through the moving average in one felled swoop. That’s enough to exit a long, but shorting that would not have been easy. The back-kiss that came later in the week near 41 presented a calmer and easier entry with a clearly defined stop.
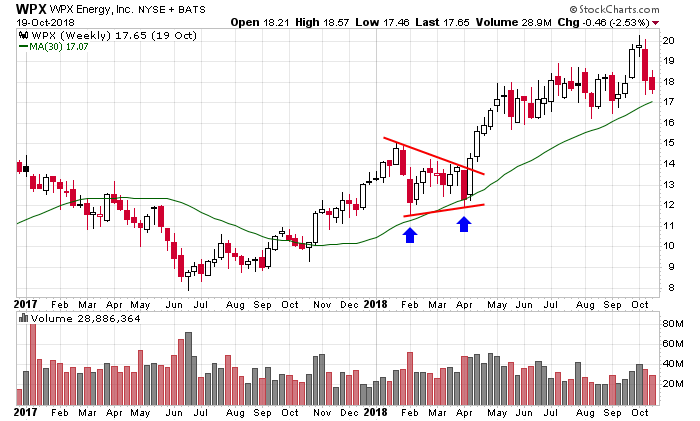
Kisses also work on weekly charts. WPX put in a bottom in July-Sept 2018 and then moved above its 30-week MA. If you don’t feel comfortable buying a close above the moving average, which in the past had been in sync with the stock, a trader could have waited until the MA was successfully tested at a later date. This came in February and April 2018. Buying a successful test increases the odds of success, and the MA identifies a tight stop.
Moving Average Crossovers
Moving average crossovers entail a shorter term moving average crossing a longer term moving average, giving a signal in the cross direction. This is similar to MACD, which uses 9 and 26 as its default MAs. Moving averages lag because they are based on prior data. Even after the underlying starts to move, it takes time for the MAs to “catch up” and be in sync. Because of this, a crossover won’t occur until after a stock has begun to move, so late signals are common. The degree of lag will depend on the length of the moving averages. If used as an entry technique to the long side, you’ll be entering a stock that has already moved off a low. If used as an exit technique, more times than not, you’ll exit after a stock has given back a portion of gains. Similar to Price Crossovers above, it is the opinion of the author Moving Average Crossovers is not a good strategy. In a flat or range bound period there will be many false signals, likely resulting in moderate losses because the signals come late.
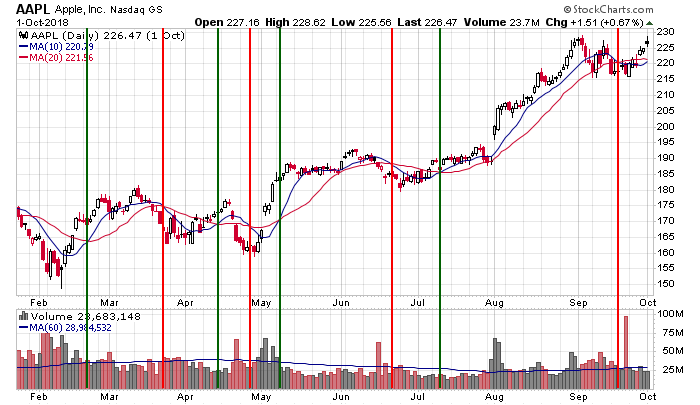
In this AAPL example, if a trader bought every time the 10-day MA crossed above the 20-day MA and then sold when the 10 crossed back down, he would have gotten chopped up while the stock traded in a range but then nailed a 40-point move starting in early July. In hindsight the net is a gain, but AAPL could have easily traded in a range for an entire year and grinded a trader’s account down to nothing. This is similar to price crossover discussed above. I’m not sure it’s better than other indicators that attempts to nail trending moves.
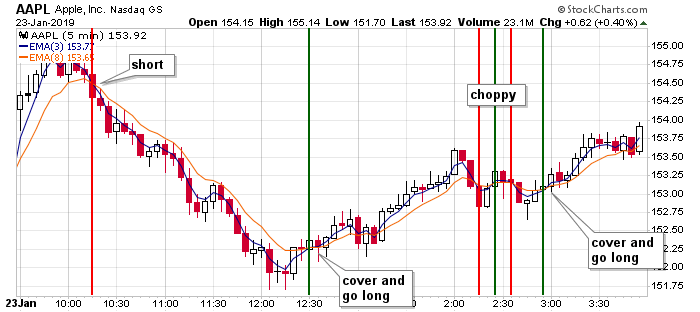
A better use of moving average crossovers is for day trading intraday charts. The AAPL chart below has a 3- and 8-period EMA on a 5-min chart. Shorting when the 3 crossed below the 8 and covering and going long when the 3 crossed above the 8 worked great. As long as a stock has trending tendencies, this strategy works very well. But if it chops around, which most stocks do most of the time, a lot of damage can be done to a trading account, even when the underlying doesn’t move much.
Moving Average Kisses
Building on moving average crossovers above, an alternative to blindly buying or selling when one MA crosses another is to demand the shorter term MA successfully test the longer term MA before entering. By adding this requirement, many false signals will be avoided, and you’ll trade much less often, with higher odds of success.
The test is called a kiss, for reasons you see below. This occurs when a shorter term moving average crosses a longer term moving average and then comes back to the longer term moving average to “kiss” it before establishing itself in a trend. This is similar to the price kisses discussed above. For traders who don’t want to get whipsawed by constant up and down crosses, waiting for a kiss can eliminate many false signals and enable traders to trade fewer, higher-quality opportunities instead of every stock that meets easy-to-meet criteria. In this sense, a trader is playing a continuation of a trend, after the trend has started, instead of trying to enter at the beginning of a move, where odds are worse than 50/50 a trend will develop.
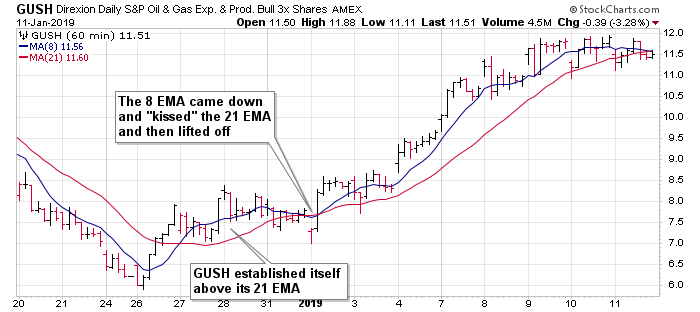
GUSH hourly chart with a 8- and 21-period MA. The stock put in a bottom in the last week of December and established itself above its 21. Blindly buying when the 8 crossed the 21 would have been followed by a few days of frustration. But waiting until the 8 came down and kissed the 21 the following week, signifying the stock had rested long enough and was ready to continue up, was much better timing. Perhaps the entry was at a slightly higher level, but the odds of success were greater. In essence, a trader isn’t buying the first move, when the stock is simply bouncing within a downtrend. He’s buying the beginning of the second move, which has much higher odds of success.
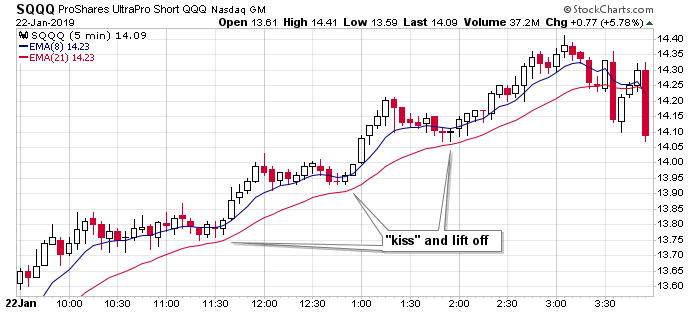
SQQQ 5-min chart with 8- and 21-period EMAs. When the 8 EMA came down and kissed the 21 EMA ad then lifted off, the trend reasserted itself. Instead of randomly buying within a range, a trader can wait for a kiss to enter. This ensures he’ll find out quickly if the trade will work or not. This is the best use of a moving average kiss – to play a continuation within a trend.
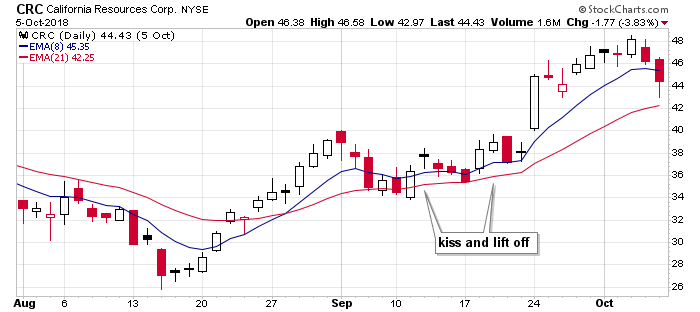
CRC daily chart. The stock moved up the second half of August and then moved sideways for 3 weeks before continuing up. Buying when the 8 crossed the 21 would have been uncomfortable because the stock had just rallied more than 30% via a steady win streak. But, although waiting for the 8 to kiss the 21 would have resulted in a slightly higher entry, the odds of success were higher, and the stock was much more ready to continue its move. The first move was just a bounce within a downtrend; there was no guarantee it wouldn’t roll over soon after. The second move is a continuation move; it comes with much less risk and takes place when the stock is more ready.
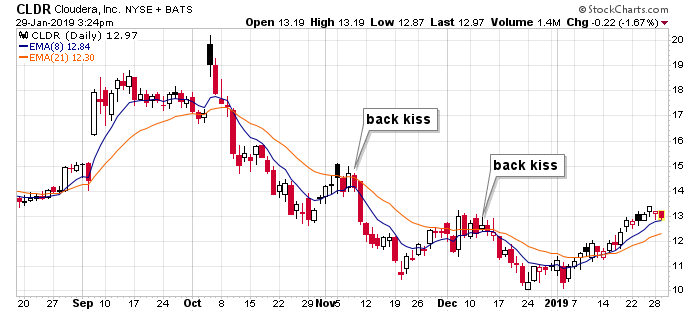
CLDR daily chart. Kisses help time short entries too. The stock gapped up but gave it all back within a few days in early October. A downtrend followed. Short entries could have been timed with back kisses of the 8 to the 21-EMA for respectable continuation moves.
Employing Multiple Strategies on Multiple Time Frames
In isolation some of these strategies work just fine. Keep it simple and stay disciplined, and over time a trader can do very well. But to truly unlock the power of moving average, combine strategies. A moving average cross may put a stock on a trader’s radar. Then a moving average kiss on a different time frame may trigger an entry. Then a different moving average on a different time frame that acts as support may be used to identify a trailing stop.
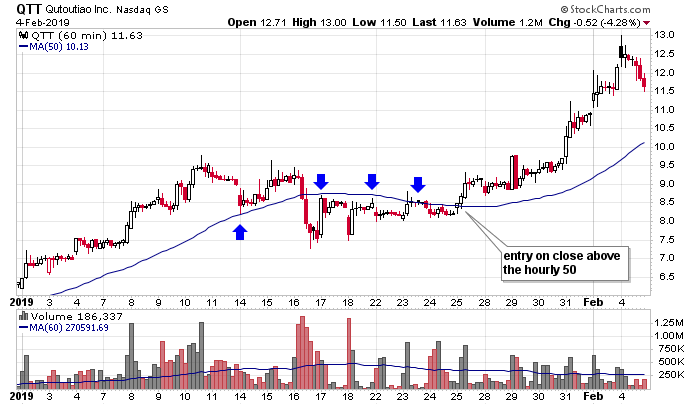
QTT. It was a relatively new stock that formed a rock-solid rounded base and then more than doubled. The 21-day MA on the daily shown below twice acted as support in December, so this was a moving average that was likely to get retested at a later date. When it proved to provide support in January, getting long was the trade, but it’s not obvious from this chart where the entry was. Zoom in with a shorter time frame chart.
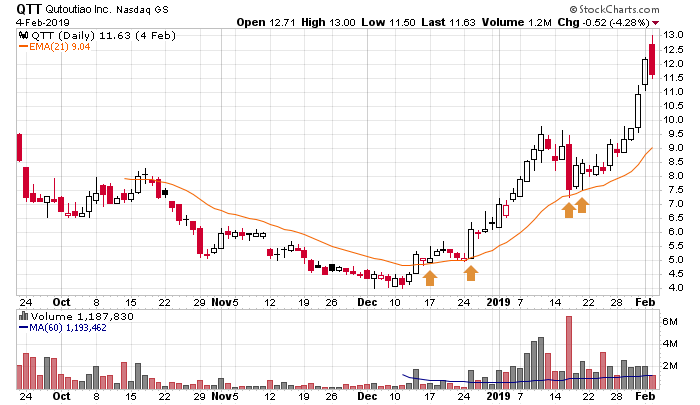
Zooming in with an hourly chart we see the 50-period MA acted as support on December 14 and then turned the stock back a few times the following week. This gave traders perspective. When the MA was taken out on December 26, an entry was triggered.
Then, the 21-period MA on the hourly supported the stock while it ran up better than 40%.
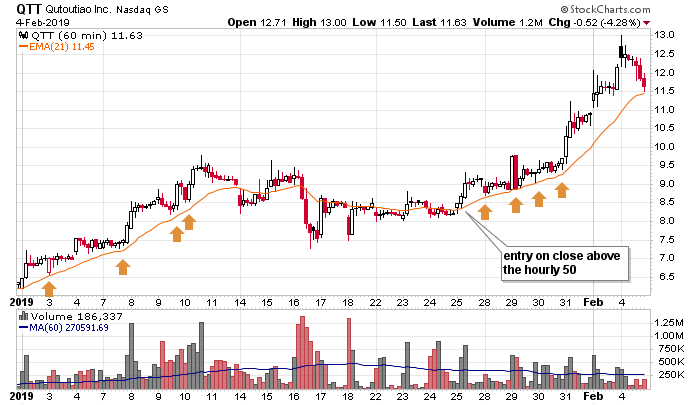
The daily chart identified a stock and an area a trader should look to get long. Zooming in, an entry can be found on a shorter time frame chart with a different moving average. And then the position could have been managed with yet another moving average.
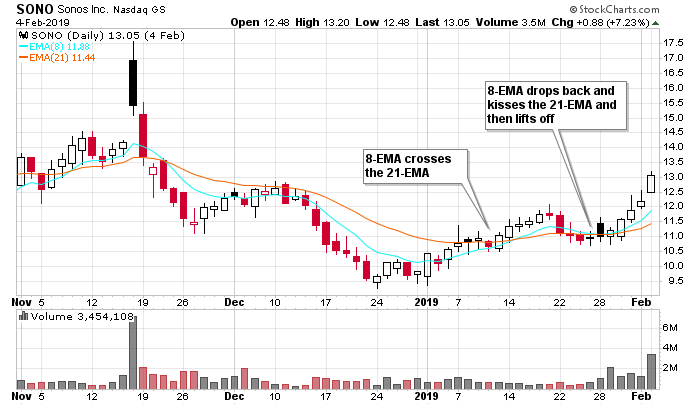
SONO. The stock trended down from mid-November to late December (notice the bearish 8/21 kiss in early December that marked a continuation of the downtrend). The stock then rallied enough to force the 8 to cross the 21 the second week of January. This put the stock on traders’ radars. Then the positive 8/21 kiss identified an area to consider a long.
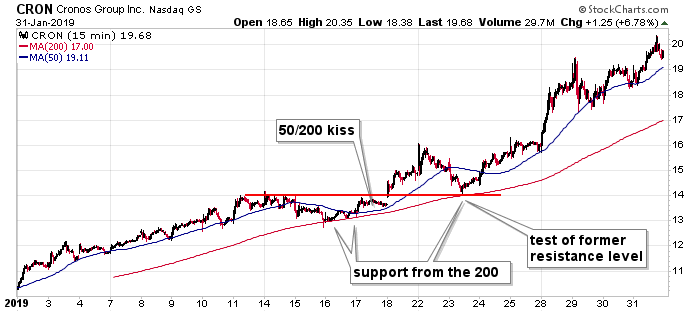
Zooming in with the hourly chart we see the stock is doing a little dance with both the 50 and 200-MAs. The last two weeks of January, when the stock got supported by the 200 and then traded through the 50, a long was triggered.
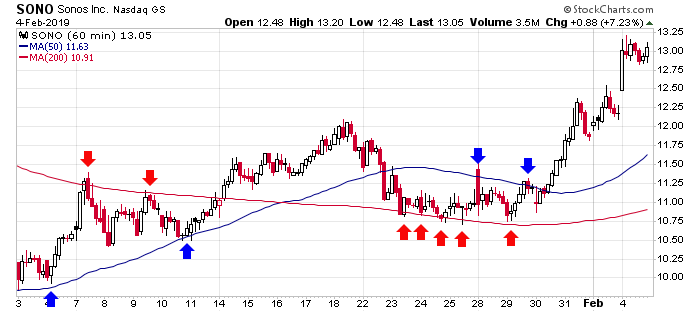
The 8/21 cross and then then 8/21 kiss on the daily identified an area we wanted to get long. The hourly helped pinpoint an entry and gave us an obvious stop.
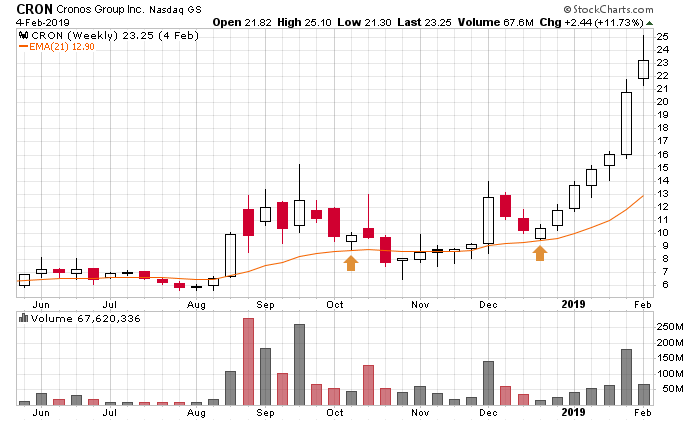
CRON. The stock traded in a wide range and then found support at its 21-week moving average in mid-December. This identified an area to potentially go long, but it’s hard to find an entry on a weekly chart, especially with a stock that can move 10-20% in a week. Being late or early could be very costly. Let’s zoom in.
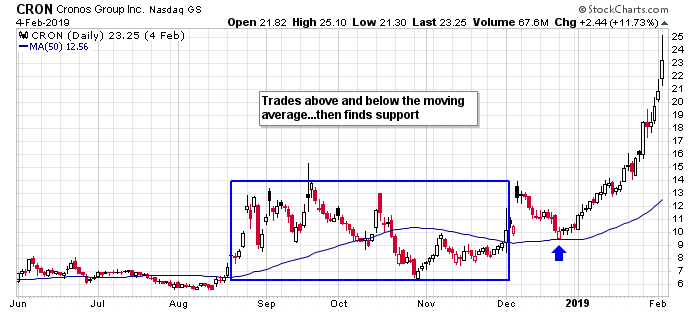
The daily identifies the same area near 10 bucks to look for a long. Notice how the stock traded above and below its 50-day moving average and then found support at the moving average. This is a sign the stock, which was previously dead money, was about to exit its range and enter a trend. Let’s zoom in again to fine tune an entry.
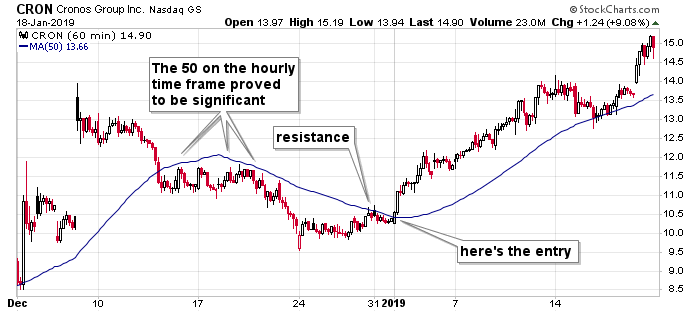
We get much better detail on the hourly chart. The stock was capped by its 50-period MA in the middle of the month and then was held back again at the end of the month. This gave us a frame of reference to judge the stock. That moving average was the line in the sand. It identified the level that needed to be taken out to trigger a long. Once the stock broke out and got moving, the MA supported the stock two weeks later on a relatively minor dip.
Zooming in one more time with the 15-min chart. Not only did the hourly 50 support the stock (above), the 15-min 200 did too (in red, below). Notice how the stock broke out at 14, and after running up to 16, it came back down to test both the previous resistance level and the up-trending 200 before legging up again. Zooming in with multiple time frames not only assists in the entry, it helps manage the position too.
Moving Average Hand Off
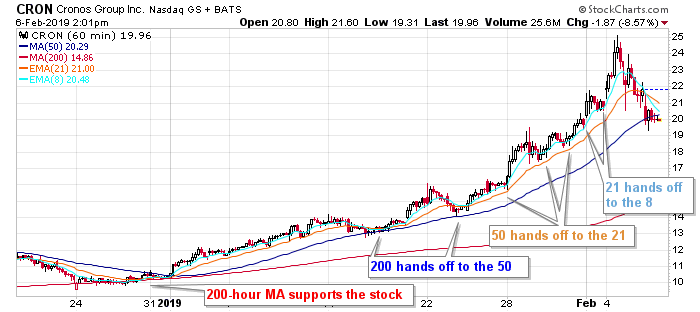
CRON. This is not a trading strategy per se, but it’s something that plays out often and should be tracked. As momentum builds in a trending stock, the moving averages will “hand the stock off.” In the hourly CRON chart below, first the 200 will support it. Then, as momentum builds, the 50 will support it. And then, as momentum accelerates even more, the 21 takes the baton. Finally, the 8 takes over, and since this is unsustainable for long, the stock breaks down and drops 20% within just a couple days. Watch for this. As trends accelerate, shorter moving averages will take over until it’s just not possible to maintain the rate of accent. Knowing this enables a trader to trail with more appropriate stops that will capture most of a move. In the chart below, a trader can take profits at the 8 or 21 and not wait all the way until the 50 is taken out.
Conclusion
Moving averages are very simple, yet very constructive and helpful indicators. For starters a quick glance can tell a trader what the trend is and whether a stock is “in” play or off limits. Beyond this there are a handful of ways MAs can be incorporated into a trading strategy. The lines often act as support and resistance, and therefore give traders a frame of reference to use when gauging a stock or the overall market. And using simple “kisses” can help time entries, so a trader doesn’t have to stress in a stock that isn’t ready to move. In the author’s opinion they are a must, either as a backdrop or intimately incorporated into one’s trading methodology.
Hi,
I use the keltner bands set to 5 sma, macd 5,27,9 and mfi 20/80/7 or 20/80/14 and trade mostly reversals when oversold/overbought.paying the most attention to the Macd when it crosses from below /above and since I trade mostly credit/debit spreads I exit the loosing leg as soon as a up/down trend is established and keep an eye on the remaining leg via chart ,which tells me when to exit that leg before expiration.It’s a little more difficult with Iron Condors but works well with other spreads.Please let me know what you think about the above
Thank you
A very comprehensive article on Moving Averages. Thanks, Jason … really well done.
Currently I’m using the 50 and 200 day SMA. Also, the 30 week SMA (or switching to the 20 0r 50 weekly SMA if they correlate closer with the price action.)
In the past, I have used the 8/21 EMA for daily, weekly and monthly, the 20, 50, and 200 daily EMA and the 8/65 daily SMA and a 65 daily SMA with a 3% band.
Good compilation- AS an EOD investor, I use a Daily and also a 2 hr chart- Price with a Fast 4 ema, 10, 20, 50 for reference….Allows me to capture the early turns – raise cash early on price turns- -but also comes with whipsaws–
Like all things TA- practice the application you choose over different market conditions, to discover when it proves most effective.
Thank you for this very comprehensive overview of moving averages. It is very helpful and appreciated.
Kevin