This is LB Weekly – our weekly report which backs up, sees the bigger picture and analyzes the trends and the staying power of those trends. It can be subscribed to as a stand-alone product at LeavittBrothers.net for only $149/year.
—————
Not a Leavitt Brothers subscriber but appreciate our work? Consider making a small donation.
—————
Last week was all about the Fed – not for what they did, but for what they said.
The Fed’s stated job is supposedly to keep inflation at about 2% and maximize employment. Inflation seems well within their influence, given their indirect control over the money supply. Employment is a little fuzzy. The Fed doesn’t start companies and provide employment, so reading between the lines, they can grant themselves the liberty to adjust rates in a way that will improve the business environment.
So this would explain why hints in the past would suggest they don’t operate in a bubble. They closely follow the stock market and world events.
Between the two – their stated inflation and employment objectives vs. their implied influencing of the stock market and monitoring of world events – I’d say they pay closer attention to the latter, not the former.
If the economy is growing too fast, they raise rates to slow it down. We don’t want a repeat of the Dot Com Bubble era when companies with very few employees, no business plan and little hope of surviving collectively cratered and brought the entire market down. The market doesn’t want animal spirits to get out of control, so they put the brakes on when things are heating up. They also lower rates to encourage lending to get the economy moving when it seems stuck in the mud. Ultimately the money supply controls almost the entire economy, so tinkering with overnight rates and the discount rate indirectly controls the economy – within reason.
The “fact” that the Fed first pays attention to the stock market as a barometer of how business is doing and looks at other metrics secondarily is why the phrase “don’t fight the Fed” was coined. Fed Chairman became heroes of epic proportions. More people know who this unelected official is than most other high ranking people in government. When Greenspan left the position, he made millions giving speeches. Heck, given the control over the money supply, the celebrity they achieve and the income possibilities after leaving office, one could argue the Fed Chairman is as powerful as the President in many (not all) regards.
Which brings us to the last 13 months. It became very apparent in 2018 the Fed was no longer Wall Street’s friend, that the Fed no longer had Wall Street’s best interest in mind. The Fed was dead set on raising rates no matter what. It wasn’t going to take a slow and measured approach. It was very hawkish and seemed to have a one track mind to steadily raise rates back to an historically normal level. The business environment didn’t matter. The economy didn’t matter. The housing market didn’t matter. The stock market didn’t matter. Rates were going up. Period. This was no more apparent than the December meeting when, in the face of a plunging market, the Fed raised rates for the 4th time [in 2018]. Speeches by Fed officials were very aggressive. There was no nice or delicate language to suggest the Fed would be sensitive to a changing environment. Wall Street wondered if the Fed was recklessly out of control, and the market suffered because of it.
This all changed at last week’s meeting. The Fed held rates the same and completely changed their tone. Instead of reiterating their intention of raising rates several times this year, they will be patient and flexible. They will watch the stock market and will not raise if the market feels on edge. They will actually read the data and not plow forward with a predetermined plan. This doesn’t mean they won’t raise this year; it just means they will only raise if they fully believe the market can handle it. And to this, Wall Street celebrated and breathed a huge sigh of relief. The Fed was their friend again.
In my nearly-20 years of being involved with the market, I’ve never seen such an abrupt about-face change in sentiment and character. The Fed has always been late – they raise a few too many extra times on the way up and the don’t lower fast enough on the way down. Whether data lags or they want to be sure, they’re always late. For the Fed to be extremely hawkish one month and extremely dovish the next is a complete change in character. This is good now, because the market would have tanked if they didn’t lighten up. But given how quickly they changed their tune, is it good for the future? The Fed started being much more transparent during the Bernanke years. Does transparency matter if attitudes can change so quickly? Not sure.
Bottom line is the Fed is back to having Wall Street’s back. We can be somewhat confident they won’t recklessly raise rates in the face of a falling market. This doesn’t guarantee the market won’t suffer a big drop this year; it just means the Fed won’t add fuel to the fire if it happens.
The market posted solid, across-the-board gains last week. The indexes are now in the middle of their November consolidation patterns and are distancing themselves from their 50-day MAs. Trading has been much easier than in the past year. We’re in the midst of a steady move that has provided steady trading ideas. But the S&P is up 350 points in 5 weeks and has barely suffered even a minor dip. Is it realistic to think it can last much longer? When the move began I said it would go further and last longer than most think is possible. But I was thinking it would go 2 or 3 steps forward and then a step back, not 30 steps forward and no steps back.
In this situation, I don’t want to miss further upside, but I also don’t want to give profits back on trading positions should the market decide to do some backing and filling. Trail positions with stops and ride them. Maybe we squeeze out another week of gains; maybe the break over the weekend will induce a change of heart on Monday. We’ll see. With the Fed on board, Wall Street can focus on what’s important and not be preoccupied with thoughts the Fed it going to purposely tank everything. The internals, discussed below, will give us a hint of what’s brewing beneath the surface. Let’s check them out.
Indexes
The S&P 500 Monthly: The S&P monthly dipped and then recovered. It’s still possible the market is forming a major top that will take upwards of 2 years to form, and what took place the last two months was just a minor interruption. In my eyes this chart is neutral at best…and perhaps feels more toppy than anything else.

The S&P 500 & Russell 2000 Weeklies: Inside weeks have resolved up. The S&P is in the middle of its November pattern; the Russell is in the bottom half. Both have done well to recover, but the 50-week MAs loom overhead. They are key levels, so let’s not get too giddy.

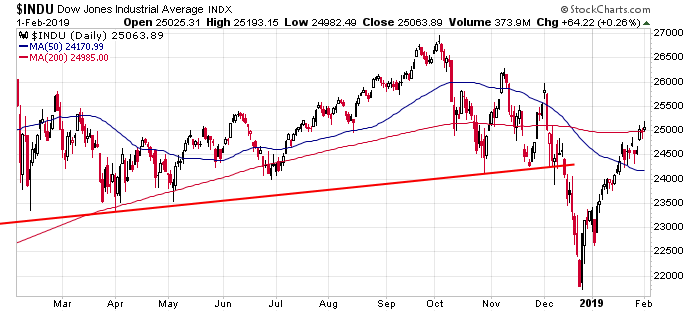
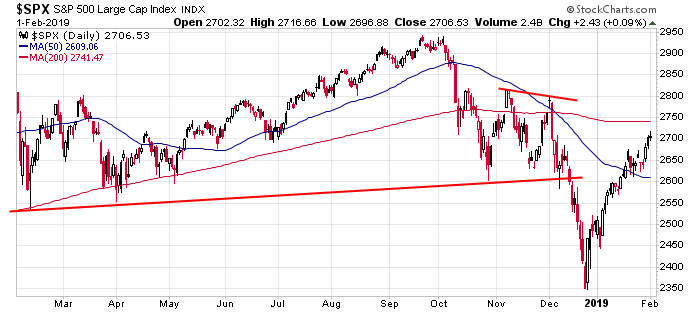
The Dow and S&P 500 Dailies: It’s encouraging the Dow and S&P were able to consolidate above their 50’s and then build on their gains. That’s the good news. The bad news is all that buying has only brought the indexes back to the levels they were at in early December. That’s a lot of energy expended just to neutralize the downtrend. The market has done incredibly well, but I don’t think we can relax.
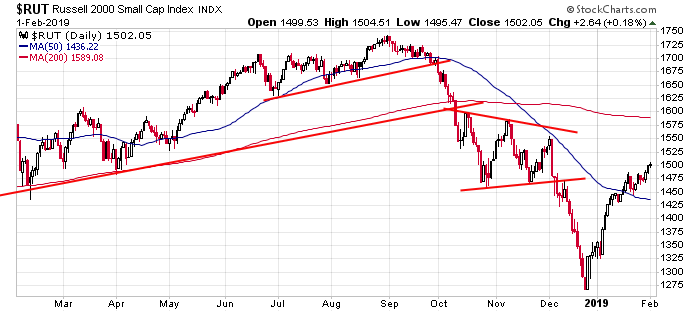
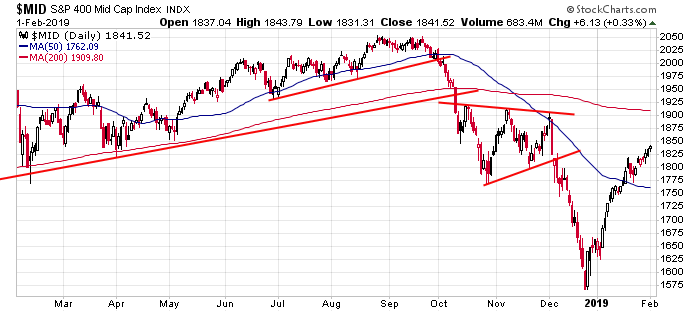
Russell 2000 and S&P 400 Dailies: Both the small caps and mid caps rallied vertically to reclaim their 50s…and then tested the moving averages before legging up to a higher high. I wish we would have gotten some sideways movement to allow some pressure to build; instead the indexes just kept pressing higher. We can’t be bearish here, but it’s hard not to shift into a defensive posture when the market has gone vertical for 5 weeks.
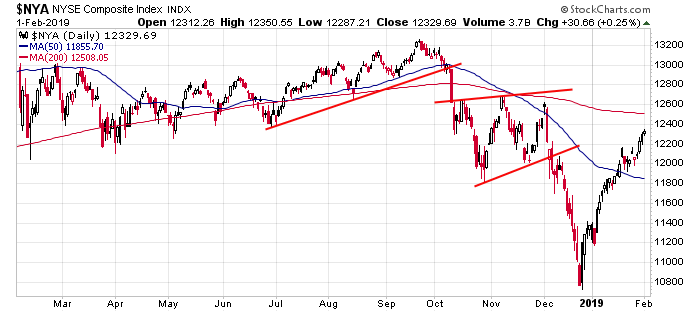
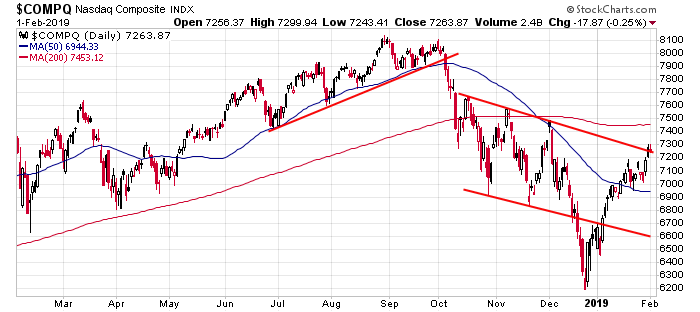
NYSE and Nasdaq Dailies: The NYSE looks like the S&P 500 – middle of its November range, between its 50 and 200-day MAs. The Nas has more of a downward feel to it and has several layers of resistance overhead. The short term trend is up, but we have to be on high alert for profit taking.
Indicators
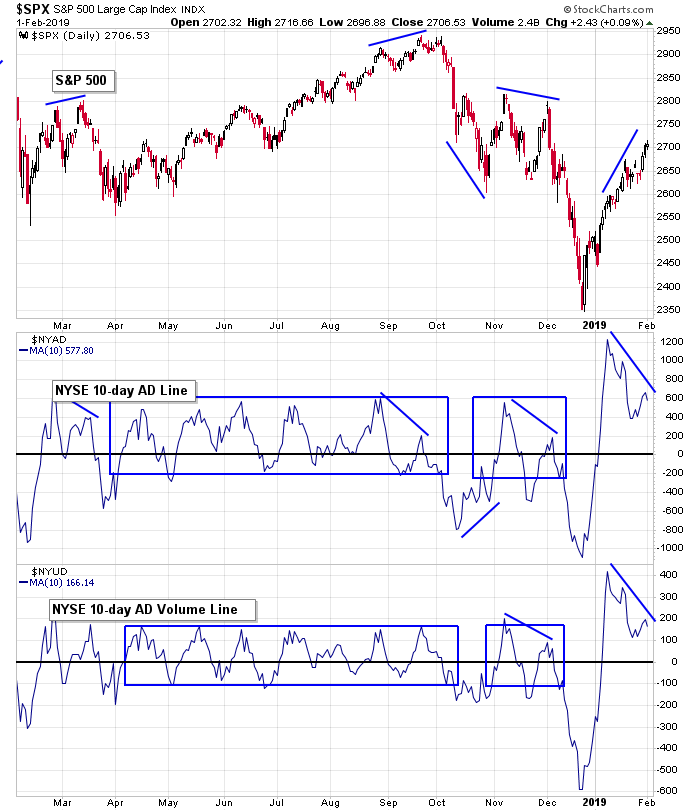
S&P 500 vs. 10-day MA of NYSE AD Line & 10-day MA of NYSE AD Volume Line: The indexes posted across-the-board gains last week, but the 10-day of the NYSE AD and AD volume lines put in lower highs and declined. This divergence can last upwards of a month. If the indicators do not firm soon, the market’s upside will be very limited (in terms of price movement and time). We need to start being more careful.
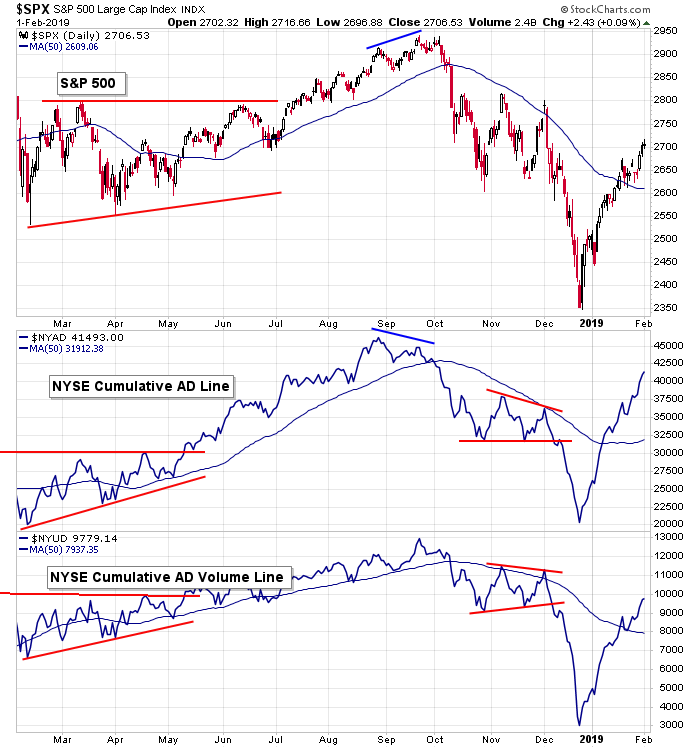
S&P 500 vs. NYSE Cumulative AD Line & NYSE Cumulative AD Volume Line: Advancers are not beating decliners by the same degree as two weeks ago, but they are still beating them. This has kept the AD and AD volume lines pointing up. If the market corrects and these lines stay above their 50’s, we can expect another decent, tradable leg up to follow.
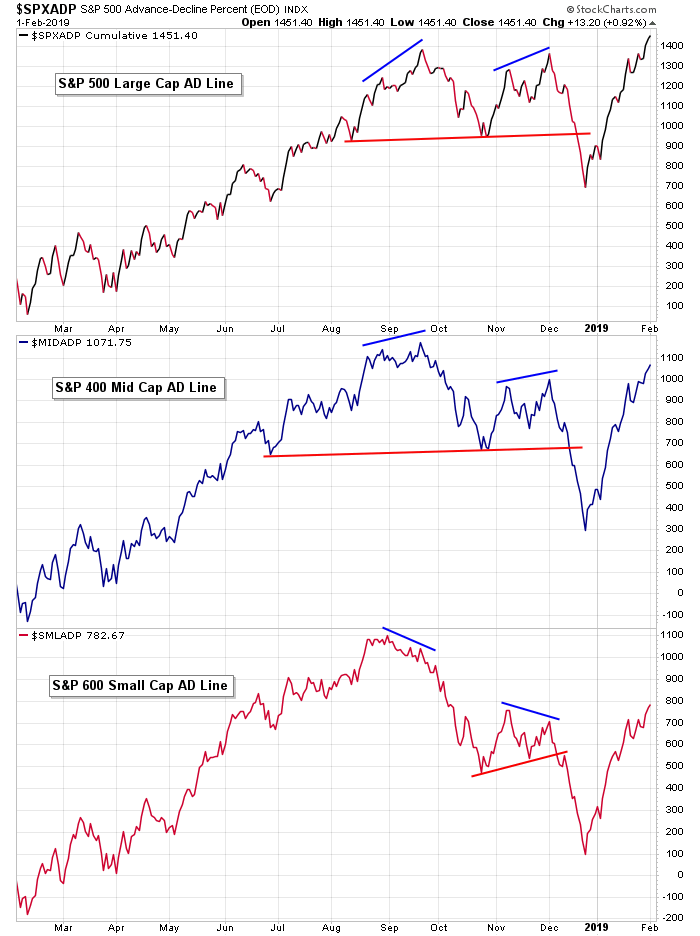
AD Lines of Large, Mediam and Small Cap Companies: The large cap AD line has moved to a new high, even though the S&P is 200+ points from its own new high. The mid cap line has recovered the bulk of its losses. The small cap version is lagging but on par with where the small cap indexes are. I don’t see warnings here. The AD lines support the price action. If these lines struggled to move up a warning would be flashed, but this isn’t the case.
S&P 500 vs. NYSE New Highs & NYSE New Lows: New highs have finally surged. Is this a sign of capitulation, where buyers who’ve been waiting for a pullback finally threw in the towel and bought at any price? Perhaps. But I think it’s much more good than bad. More NYSE stocks hit a new high last week than nearly any time the last year. This is a sign of strength. And notice the right side of the blue box at the left of the chart which contained new highs in 2017; there’s room for improvement if the market really wants to trend up for a while.

S&P 500 vs. NYSE High-Low Differential: The high-low differential at the NYSE has matched its highs from the last year. If the indicator can now roll up and down, staying mostly above 0, the market’s uptrend will continue to be supported.

S&P 500 vs. Cumulative High-Low Differential: The cumulative high-low at the NYSE is starting to curl up, but overall I don’t like what I see. It took a 350-point SPX bounce just to neutralize the indicator. If it gets rejected by the 50-day MA, we could have a repeat of early 2016 when the market tanked and did a double bottom.

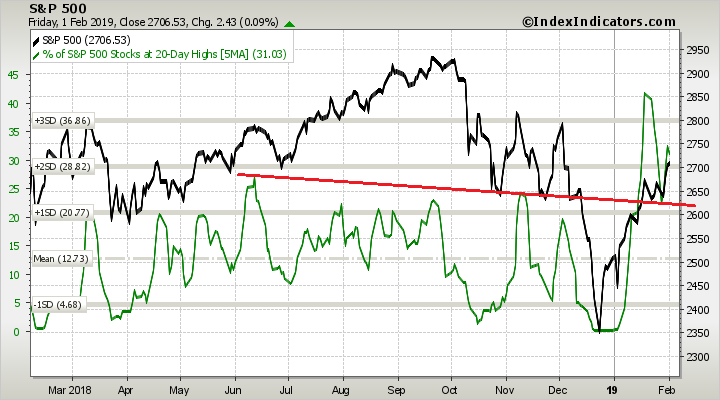
S&P 500 vs. Percentage of SPX Stocks at a 20-day High: The percentage of SPX stocks at a 20-day high has clearly broken out of a base and is now maintaining a healthy level. Fluctuations are fine; the bulls just don’t want to see an obvious divergence form.
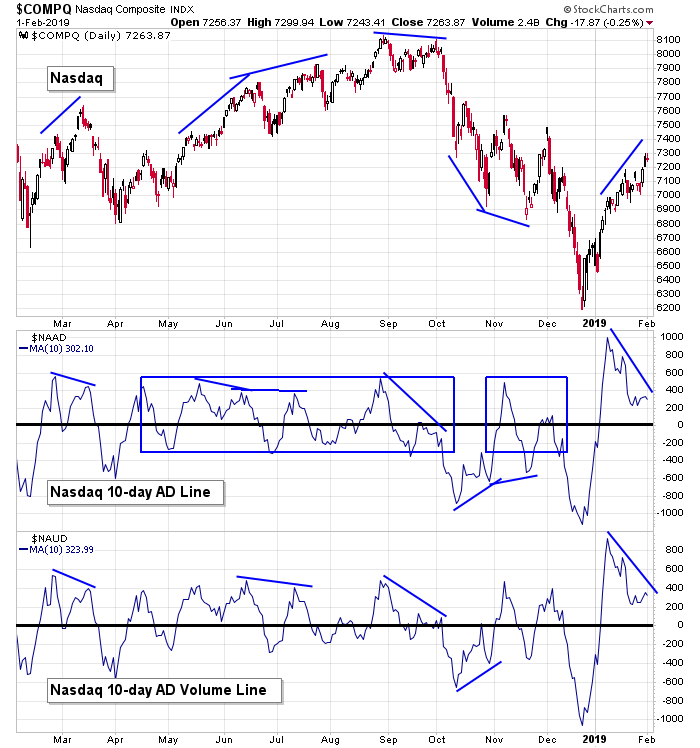
Nasdaq vs. 10-day MA of Nas AD Line & 10-day MA of Nas AD Volume Line: Like at the NYSE, the 10-day of the AD and AD volume lines at the Nas continue to diverge from the underlying index, which pushed to a higher high last week. This divergence can induce a correction at any time, so have stops in place.
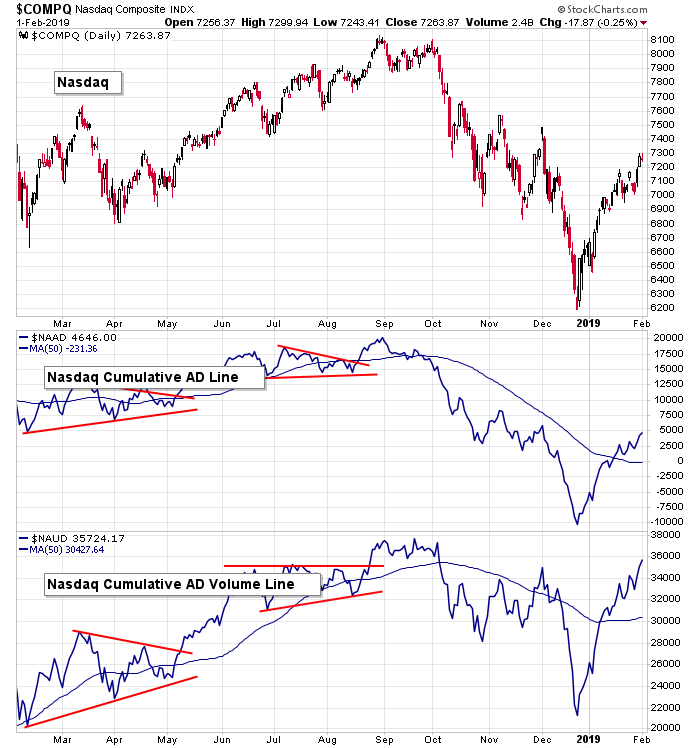
Nasdaq vs. Nas Cumulative AD Line & Nas Cumulative AD Volume Line: The cumulative AD and AD volume lines continue to float up. This bodes well for any dip that many play out. The movement of these indicators suggests the market has underlying support.
Nasdaq vs. Nasdaq New Highs & Nasdaq New Lows: New highs at the Nas moved up last week but obviously haven’t matched the performance at the NYSE. Should we be concerned? Well, the Nas itself is still 10% from a new high, so I’ll take any improvement with no negative divergence. An uptick early next week puts it at a 4-month high. Not too bad.

Nasdaq vs. Nasdaq High-Low Differential: The high-low differential at the Nas is inching up. This needs to change. I don’t have a magic threshold in mind, but at some point the indicator will need to match the gains of the index.
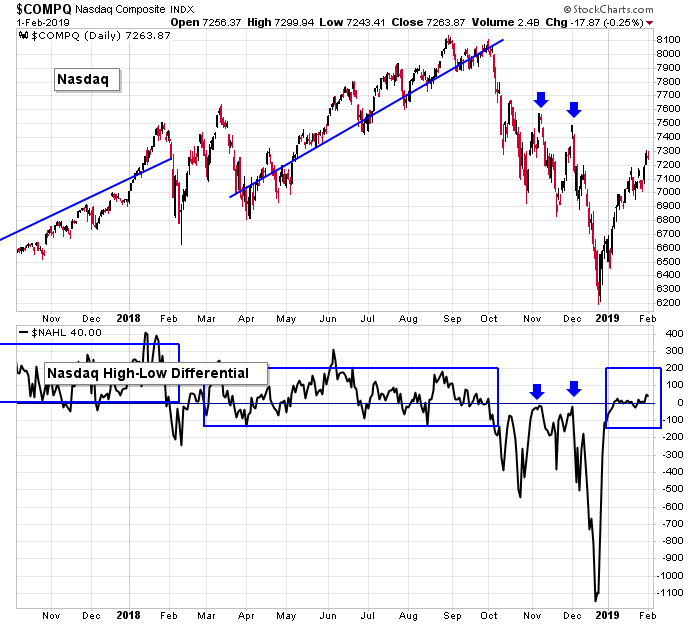
Nasdaq vs. Cumulative High-Low Differential: The cumulative high-low differential at the Nas has been flat for a month. We’re either going to get a rejection of the 50 (like the end of 2015) or just a slow grind through it (like mid 2016), but the 2016 version came with a couple 5% market dips.

Nasdaq 100 vs. Percentage of NDX Stocks at 20-day High: The percentage of NDX stocks at a 20-day high broke out from a slanted trendline but wasn’t able to take out highs from May and June. Like stated above with the NYSE, fluctuations are fine. The bulls don’t want to see a major divergence.

S&P 500 vs. Percentage of SPX Stocks Above 20-day MA: The percentage of SPX stocks above their 20-day EMAs has held at a high level. This is a very good sign. Stocks haven’t just recovered; they’ve held up and continue to do well.

S&P 500 vs. Percentage of SPX Stocks Above 50-day MA: The percentage of stocks above their 50-day MAs has matched its high from January 2018, which of course was right before a huge plunge. The market doesn’t have to head south simply because a former high was equaled, but it does tell us optimism may be a little overdone right now and we should be a little more careful.

S&P 500 vs. NYSE Bullish Percent: The bullish percent at the NYSE has moved from the bottom of its pattern through resistance at the top. No warnings here, but prints above 55% are needed to support an extended rally.

NASDAQ vs. NASDAQ Bullish Percent: The bullish percent at the Nas has moved to the top of its pattern. It’s nice, but more improvement is needed. The 52.5% level has been an important dividing line, so there’s more work to be done.

S&P 500 vs. Put/Call Ratio: The 10-day of the put/call has assisted in calling tops and bottoms over the years. When traders buy puts, signaling a desire for some downside protection, the put/call ratio spikes up, and the market tends to bottom and rally. The opposite has also been true. The put/call started to curl up Friday, so it’s another tiny hint the market’s upside may be limited in the near term.

The Bottom Line
The market continues to do incredibly well on a short-term basis, but we’re starting to see a few warnings. The 10-day of the AD and AD volume lines at both the NYSE and Nas are diverging from the price action. The cumulative high-low differentials haven’t been able to curl up yet.
But if we do get a correction soon – and we will if these indicators and others don’t improve – there’s enough underlying strength to believe the nascent uptrend will continue. The AD lines, the percentage of stocks above key moving averages, the percentage of stocks at 20-day highs – they all tell us the market’s strength is supported.
We need to be a little more cautious in the near term, but overall the indicators tell us the market is in good shape.
Have a great week.
Jason Leavitt
3 thoughts on “LB Weekly (Feb 3)”
Leave a Reply
You must be logged in to post a comment.
The debt level is real.
The major indexes are not yet printing any higher highs
Great analysis! I don’t disagree with Jason often even though we use significantly different methods we often get the same results.
I do believe a minor pullback is possible in the next two weeks. I am more bullish than Jason because the VXN is back below 20 and the total put call ratio is still high running around 1.0. I agree with Jason be on guard here being long. I am watching the PC ratio to fall below 0.70 for a couple of days.
Caution with the PC ratio if it falls below 0.45 or so BUY! The bulls will be running for a few weeks.
Paul