This is LB Weekly – our weekly report which backs up, sees the bigger picture and analyzes the trends and the staying power of those trends. It can be subscribed to as a stand-alone product at LeavittBrothers.net for only $149/year.
Not a Leavitt Brothers subscriber but you appreciate our work? Consider making a small donation.
The market’s upside momentum has declined, but the bears have not been able to take control.
There have been no noticeable dips. A down day here, a down day there. But nothing has lasted in terms of time or price declines. The S&P has closed above its 10-day moving average every day for two entire months – an incredible run of consistency. This hasn’t been a 3-steps-forward-2-steps-back type of market. It’s been 5 steps forward, 1 step back.
The 10-day AD lines at the Nas and NYSE put in negative divergences, but otherwise the internals have held up well. The AD and AD volume lines have continued up. The bullish percent charts have continued up. New highs have held up, but 20-day highs has trended down. Trading has been very good. Many stocks have followed through on their initial moves and have provided rock-solid gains, gains not seen since January of last year.
Given all this, momentum has declined. The rate of change has been declining for a month. The market is moving up but at a slower pace. In fact 4 times last week the market closed in the bottom-half of its intraday range. In the near term a little caution is warranted. Overall the market is in good shape, and for now I continue to believe higher prices are coming. But given the gains in place and the decline in quality setups to trade, we’d be wise to be less aggressive.
There are two issues with looking for a pullback. 1) If your timing is off, which is very likely is, you miss a lot of gains. Peter Lynch has talked about more money being lost anticipating corrections than in corrections themselves. 2) They don’t happen exactly how you want, so the odds of nailing the following leg up are small. Let’s talk about each issue.
1) The 10-day of the AD lines and AD volume lines started diverging from the price action at the beginning of February. If you abandoned all longs you left a lot of money on the table. If you simply stopped your operation, thinking you’ll wait for a pullback, you missed out on a lot of great trades. But if you said: “The market is strong, and we’re getting a divergence at a high level (which isn’t so bad). Let’s tone things down a little and make sure stops are in place, and perhaps we should be a little less tolerant with trades that don’t work out, but we need to keep going; there are too many good setups to believe the market is just going to tank. Besides, the best stocks are going to hold up since the market continues to improve overall.”
If this was your attitude, putting your head down and continuing (while keeping the divergence in the back of your mind) has paid off. When the market is doing well, when strength is broad-based, and the backdrop (the Fed was Wall Street’s friend again) is supportive, maintaining a long bias is where you need to be. Going to cash and abandoning you operation in hopes of re-entering lower is costly.
2) And when a correction plays out, the sequence is never perfect. The market doesn’t just drop to a previous important price level and rally. It doesn’t fall to a key moving average, find support and then blast off. It doesn’t test a key Fibonacci level and bounce. It’s never that clean and simple. It’s never that easy.
Instead a drop will either be shallower than wanted or much more. The market will drop a small amount over a handful of days and then blast off. Anyone wanting more will be left standing there waiting. They wanted lower prices to get long. They got them, but not as much as they wanted. So now they’re left pissed off and chasing.
Or the market drop…and then drop more…and then drop more. Throw in some negative news, and traders will start wondering if a top is in place. They start thinking in terms of shorting the following bounce rather than buying the dip. And then the market will bounce. And then the bounce will morph into a rally. And despite wanting a dip to buy and getting a bigger dip than they asked for, they’ll miss it. They’ll be lured to the bears’ camp, and they’ll miss a great buying opportunity. It happens constantly. It happens so often that it should be considered the norm.
First traders look for a dip, but the dip happens later than anticipated so money is left on the table. Then the dip is either shallower than expect or much bigger than expected, and in both cases, those who missed the final stages of the run up end up missing the beginning stages of the bounce. Gotta love Wall Street and how it totally messes with traders. Long term operators don’t care. Day traders don’t much either. Those that sit in the middle – most of us – have to deal with these urges.
Right now traders are looking/hoping for a pullback. It hasn’t happened yet. It will, when they stop looking. And when one finally plays out, it’ll either be shallower than desired or much more. Knowing this, guard against being on the wrong side. Guard against leaving money on the table when the underlying tone is positive. Contemplate scenarios so when traders are caught somewhat off guard, you’ll be ready to pounce.
Let’s get to the charts and see what they say.
Indexes
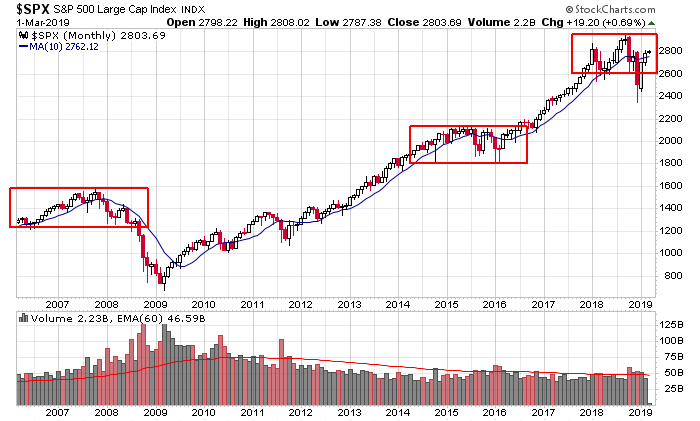
The S&P 500 Monthlies: The S&P got crushed in December but has gotten it all back. It is now virtually unchanged since the end of January 2018. You could argue a big topping pattern is forming (like 2007/08)…or a big pause (like 2014/15/16). This chart tells us the market is in a range within an overall uptrend.
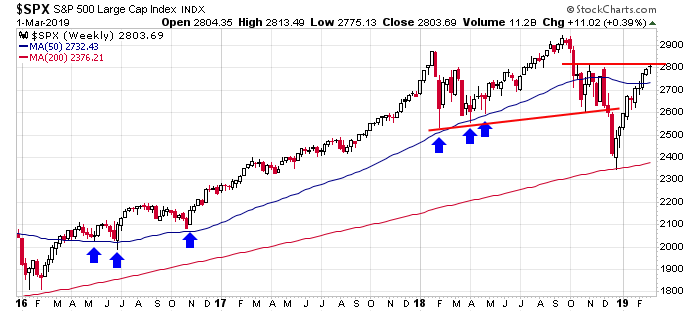
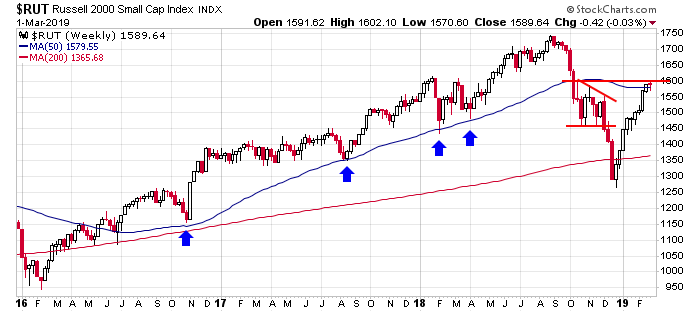
The S&P 500 & Russell 2000 Weeklies: Zooming in, the S&P registered its 5th consecutive up week and 9th of the past 10. Highs just above 2800 create an obvious resistance level with a thin area just above. If any upside momentum builds from here, the highs should be relatively easy to match. The Russell posted its first down week of the last 10 and has closed above its 50-week MA for a second straight week. This is an important level. A pause, or even a dip, followed by a rally through 1800 should propel the index up to the highs.
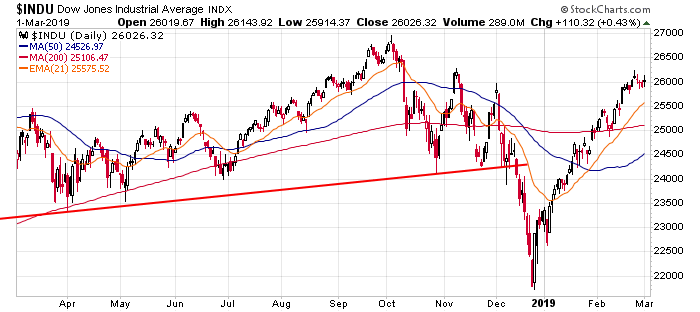
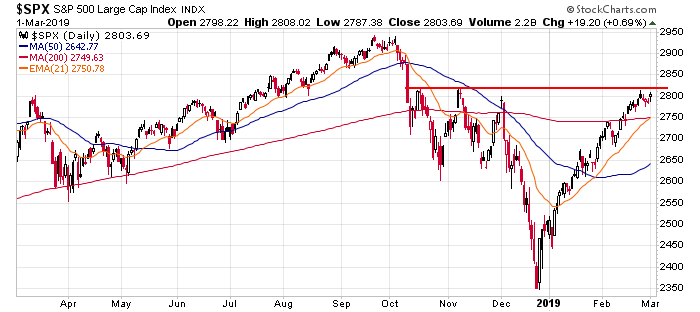
The Dow and S&P 500 Dailies: Straight down and straight up for the large cap indexes. Both paused last week just under previous highs. In fact the closes were all bunched together. It’s hard to make predictions from here. The indexes have gone up so much in such a short period of time and they don’t seem to be acting normally (Dow up 9 of 10 weeks is not a common occurrence).
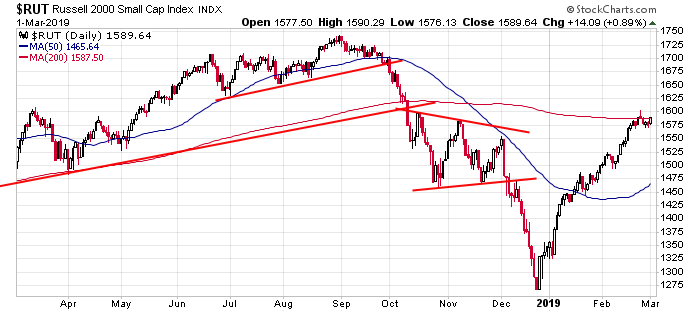
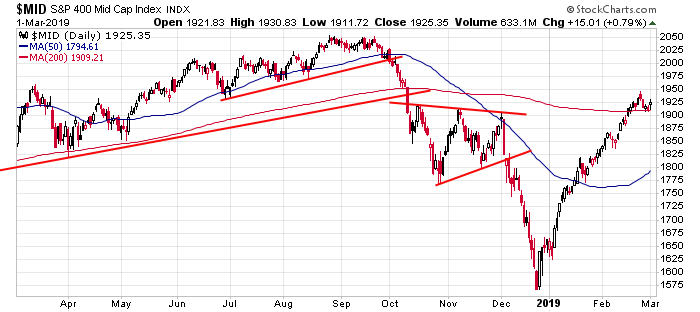
Russell 2000 and S&P 400 Dailies: The mid caps are above their 200; the small caps just reclaimed their own 200. Does it matter? Not really. The market started and finished the week strong and drifted down in between. It’s impressive that, given the gains, the bears can’t apply any pressure. The last big down day was two entire months ago.
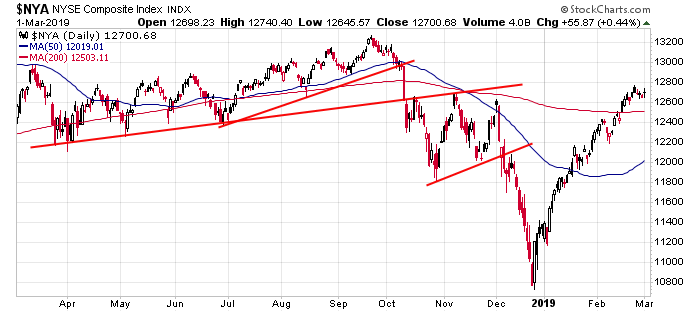
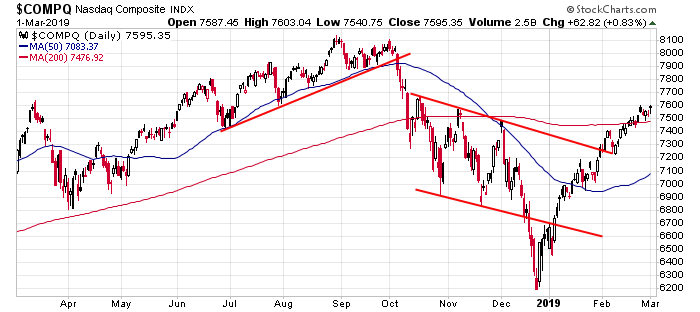
NYSE and Nasdaq Dailies: There’s nothing here that isn’t in the index charts above. A V bottom now has prices back near October and November highs. The market has a big buffer to work with, so even a 5% drop would be considered a dip within a newly-formed up trend. The Nas has posted a gain for 10 straight weeks for the first time since 1999. This isn’t normal.
Indicators
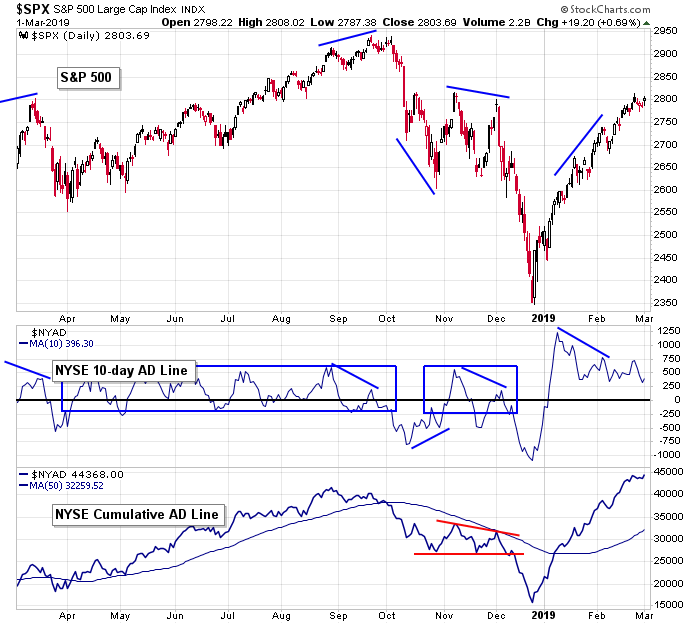
S&P 500 vs. NYSE AD Line (10-day & Cumulative): I feel like we’re in uncharted territory with the 10-day of the NYSE AD line because it has maintained a high level for such a long time. We haven’t gotten the normal ebbs and flows that would suggest buyers are alternating between being aggressive and backing off. We still have a little bit of a divergence in place, but it’s taking place at a high level. Meanwhile, the AD line flattened out last week but is still near its high. The market is doing well, and it has a cushion to work with.
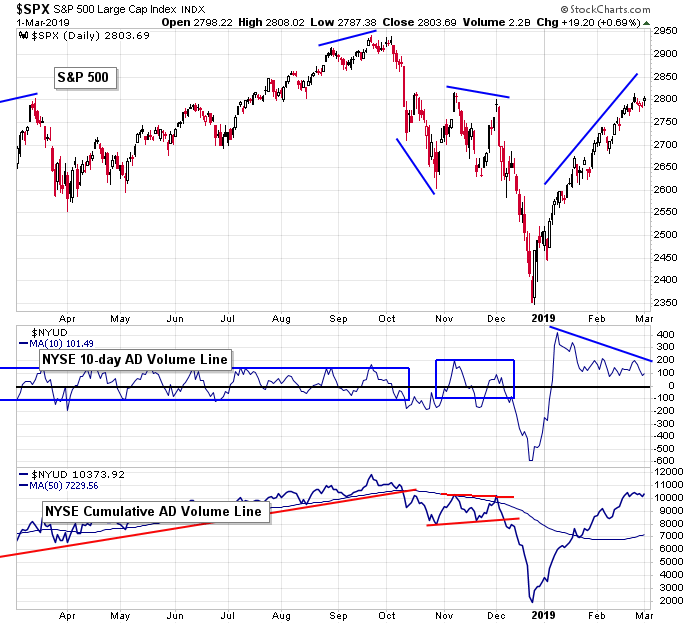
S&P 500 vs. NYSE AD Volume Line (10-day & Cumulative): The 10-day of the AD volume line is still moving down. Advancing volume is stronger than declining volume, but by a smaller margin than when the rally picked up steam in early January. The cumulative line hasn’t matched it high yet, but neither has the market. We’re getting a near-term warning, but overall things are good.
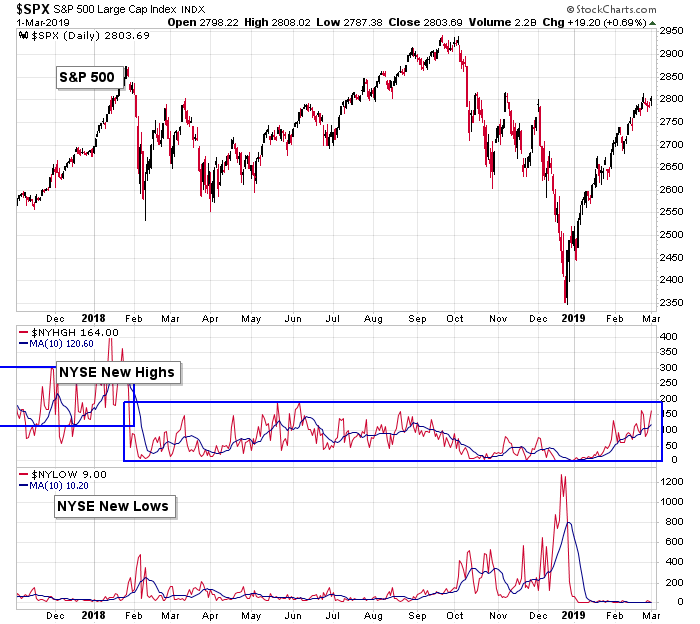
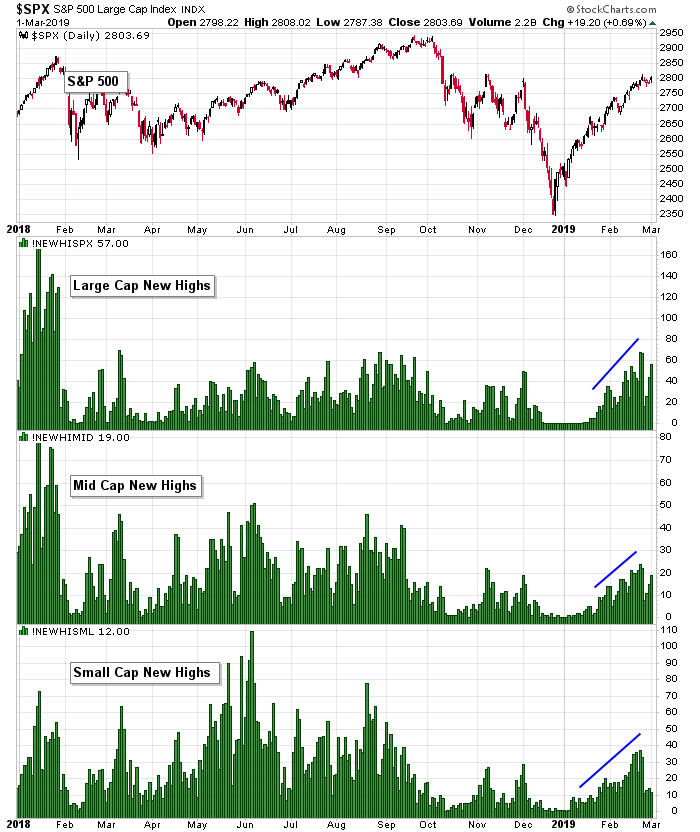
S&P 500 vs. NYSE New Highs & NYSE New Lows: New highs continue to trend up. On Friday they hit their highest level since January 2018. This fully supports the market’s trend and likelihood of higher prices.
S&P 500 vs. Large Cap, Mid Cap & Small Cap New Highs: New highs of all market caps are expanding, so strength is not concentrated in a small number of large, influential stocks. We’re getting across-the-board participation. But they didn’t decline last week, especially among the small caps.
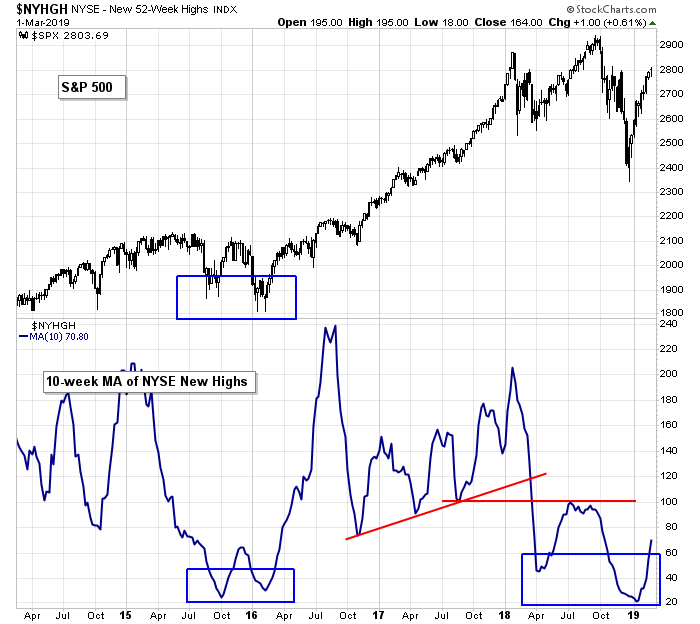
S&P 500 vs. NYSE New Highs (weekly): New highs on a weekly time frame continue to move up with a little force. The April 2018 low didn’t hold the indicator back; soon we’ll see what happens at 100, a key level the last year.
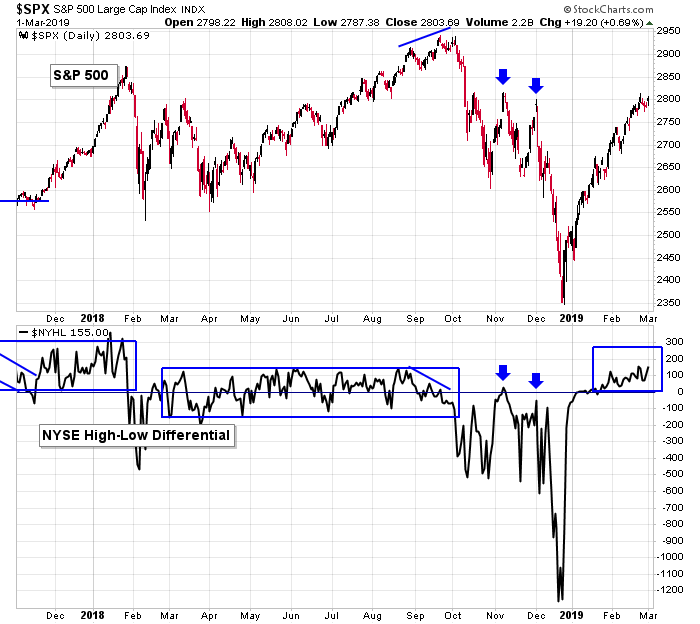
S&P 500 vs. NYSE High-Low Differential: With new highs moving up and new lows sitting at lows, the NYSE high-low differential has exceeded all prints going back 13 months. The indicator is moving up and has been above 0 for about 6 weeks. There is definitely some underlying strength in the market.
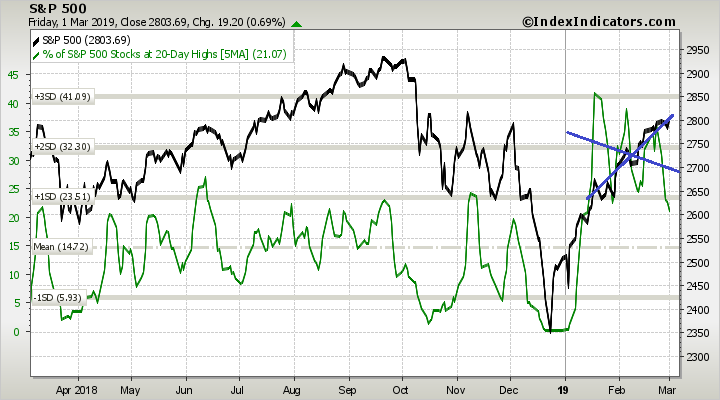
S&P 500 vs. Percentage of SPX Stocks at a 20-day High: Here’s our biggest warning heading into the new week. As the S&P has climbed, less stocks are hitting 20-day highs, so the participation rate in the new term is waning. And last week we got our lowest print since the second week of January.
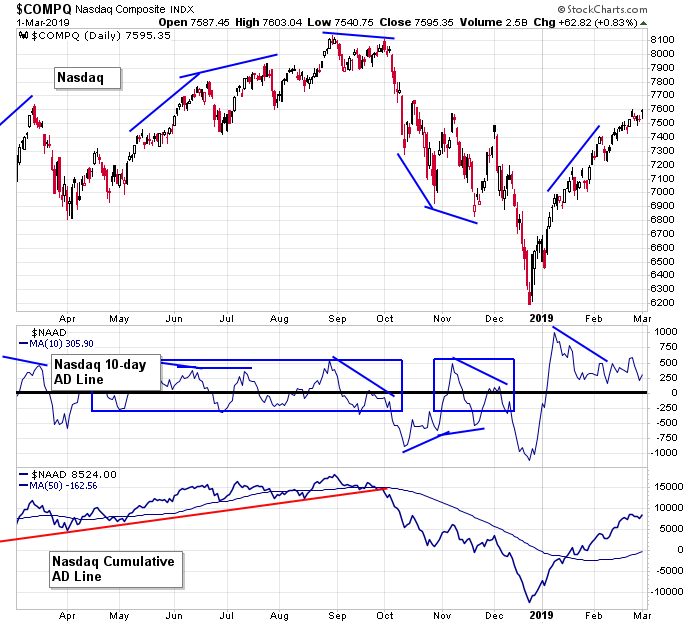
Nasdaq vs. Nas AD Line (10-day & Cumulative): The 10-day AD line at the Nas moved to a 1-month high and then dropped back into its range. Steady prints above 0 tell us the bulls are in control. The cumulative line hasn’t approached its high yet – this is to be expected because there are a lot more junk stocks that trade at the Nas than at the NYSE. The market is doing well, and per these indicators, there’s a buffer to work with.
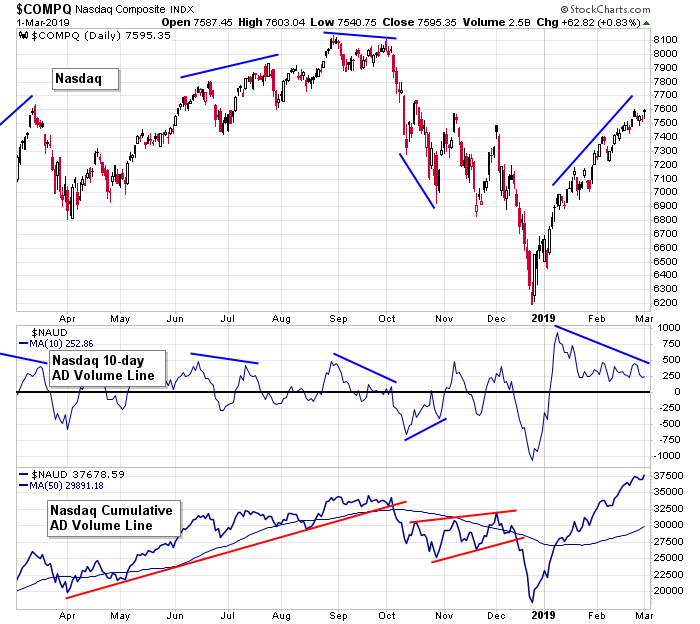
Nasdaq vs. Nas AD Volume Line (10-day & Cumulative): The 10-day AD volume line continues to diverge from the Nas, but it has flattened out the last month, suggesting the divergence is over and we should be content with steady, above-zero prints. The cumulative AD volume line is at a new high.
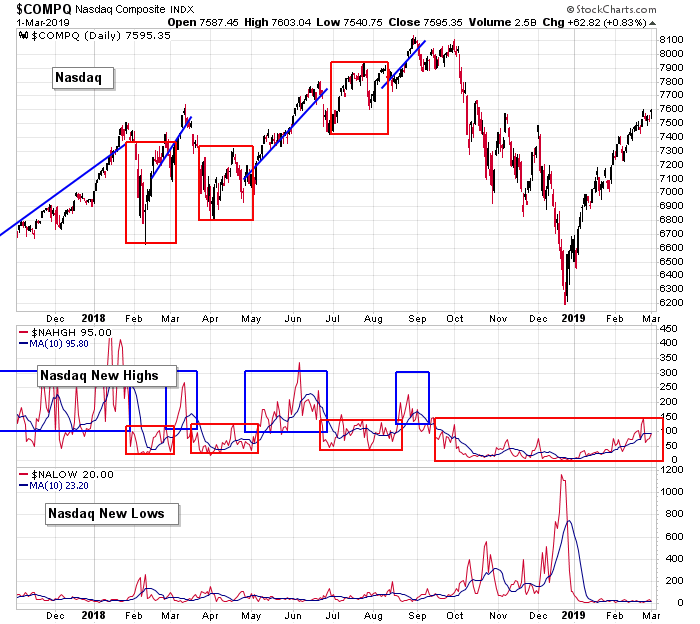
Nasdaq vs. Nasdaq New Highs & Nasdaq New Lows: New highs at the Nas ticked up last week but then dropped into the weekend. The 10-day of new highs has flattened out but is still at its highest level in a about 6 months. Keep it simple. The new-high trend is up. This is meaningful.
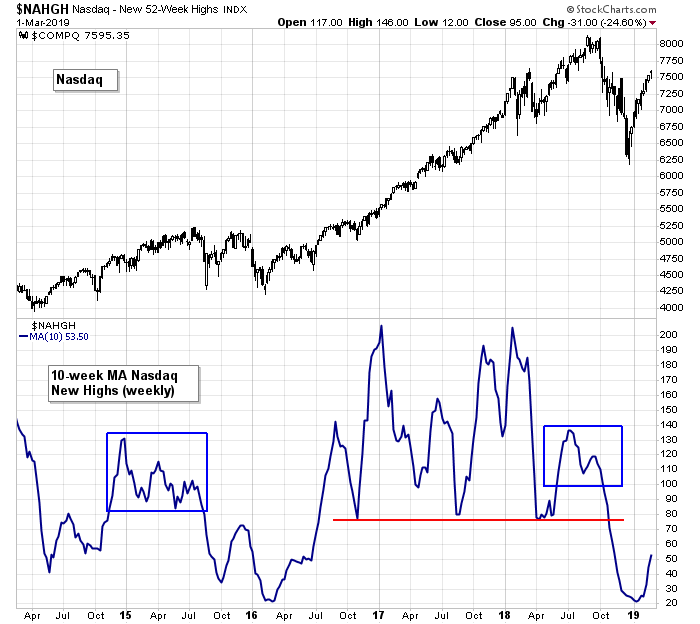
Nasdaq vs. Nasdaq New Highs (weekly): New highs at the Nas on the weekly time frame continue up. Bears will say the lack of new highs is a warning. Bulls will say there’s tons of room for improvement.
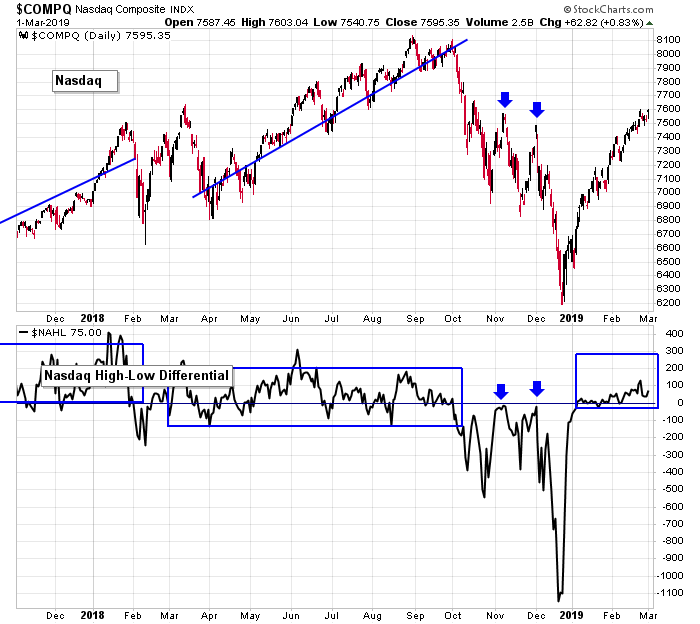
Nasdaq vs. Nasdaq High-Low Differential: The high-low differential at the Nas continues to trend up slowly overall. It’s doing fine. It supports the market’s strength. If the low print from December is truncated near -500 and the 0 line was in the middle of the chart, the current performance would look a little more encouraging.
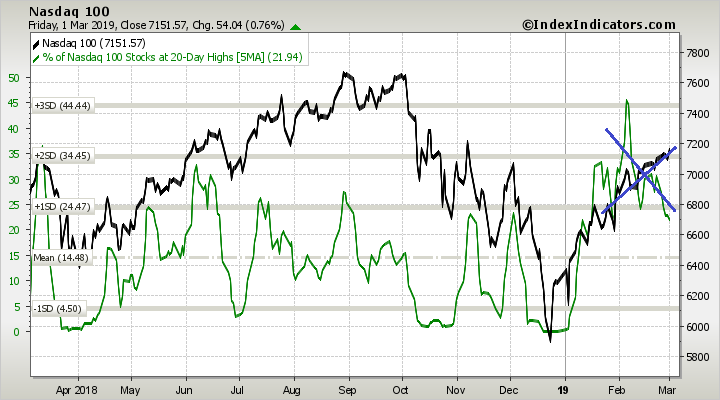
Nasdaq 100 vs. Percentage of NDX Stocks at 20-day High: The percentage of Nas 100 stocks at a 20-day high put in an obvious negative divergence and then dropped to a 1-month low, in the face of the NDX pushing upward. This is a warning. Less stocks are participating.
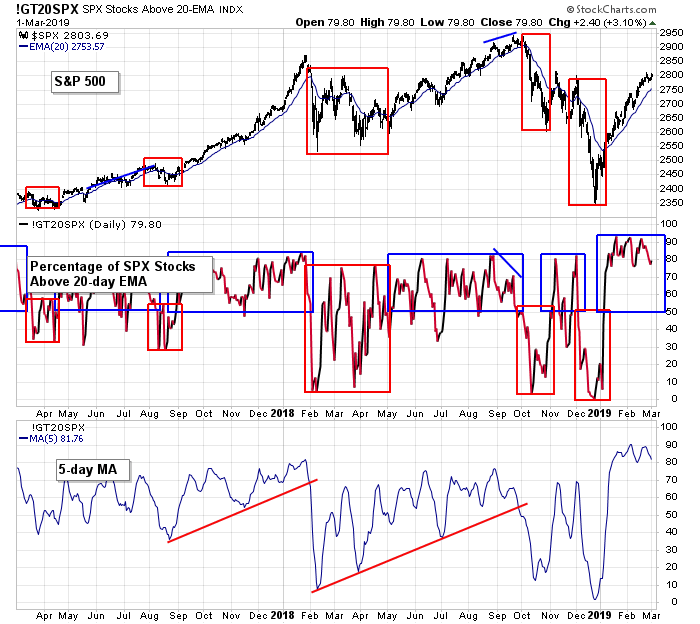
S&P 500 vs. Percentage of SPX Stocks Above 20-day MA: The percentage of SPX stocks above their 20-day MAs continues to maintain a high level. Early 2016 was the last time the 5-day was able to maintain a prints this high, and we all know what took place after that (a 2-year rally).
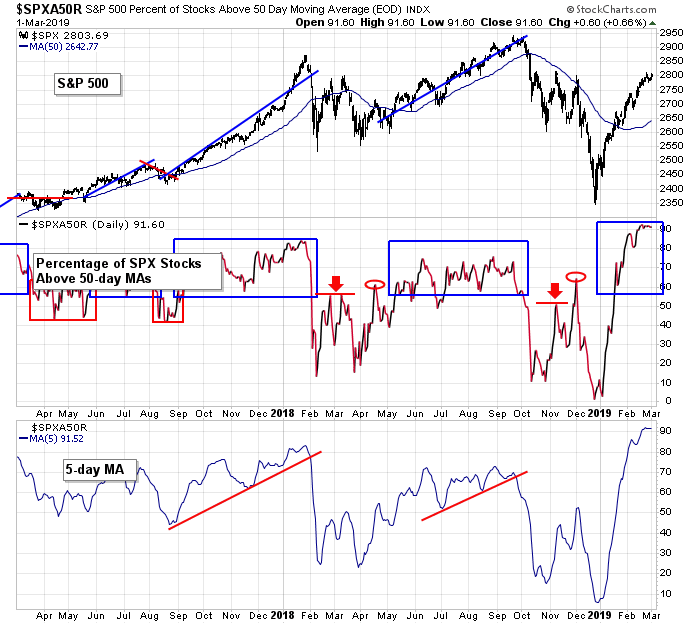
S&P 500 vs. Percentage of SPX Stocks Above 50-day MA: The percentage of SPX stocks above their 50-day MA has matched a level not seen since soon after the market bottomed in early 2016. Strength begets strength. This is a good sign.
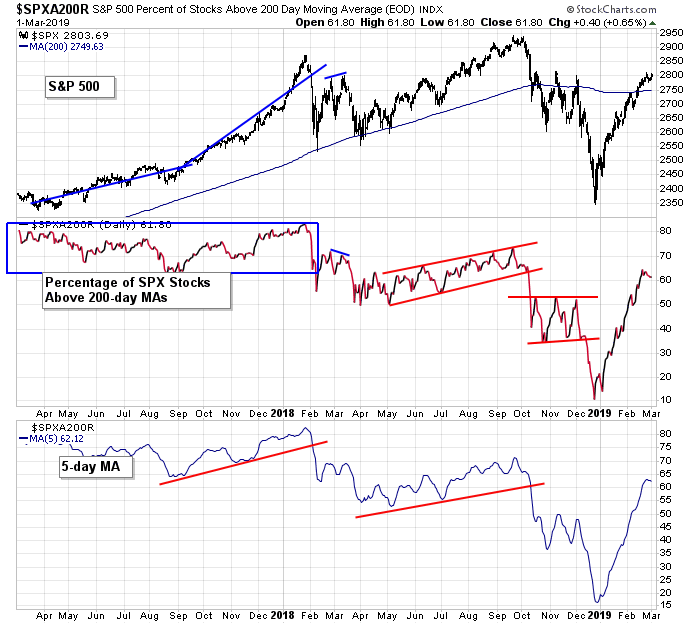
S&P 500 vs. Percentage of SPX Stocks Above 200-day MA: The percentage of SPX stocks above their 200-day MAs continues to improve. To fully support a sustained rally higher prints are needed, but at least the indicator is improving.
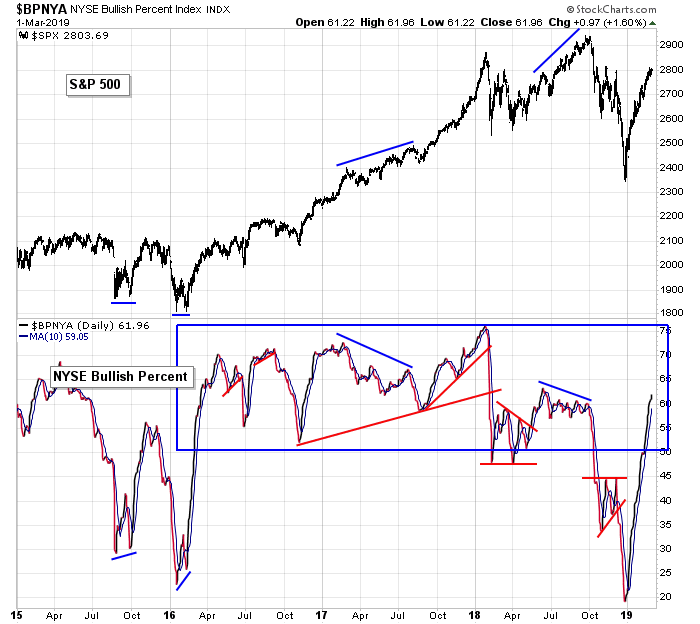
S&P 500 vs. NYSE Bullish Percent: More and more NYSE stocks have a buy rating on their point-n-figure charts.
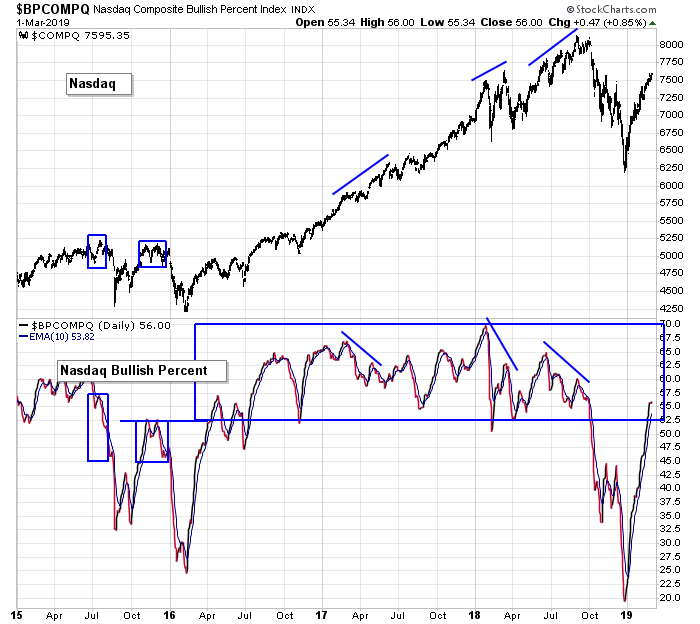
NASDAQ vs. NASDAQ Bullish Percent: The Nas bullish percent has moved into the zone that supports an uptrend.
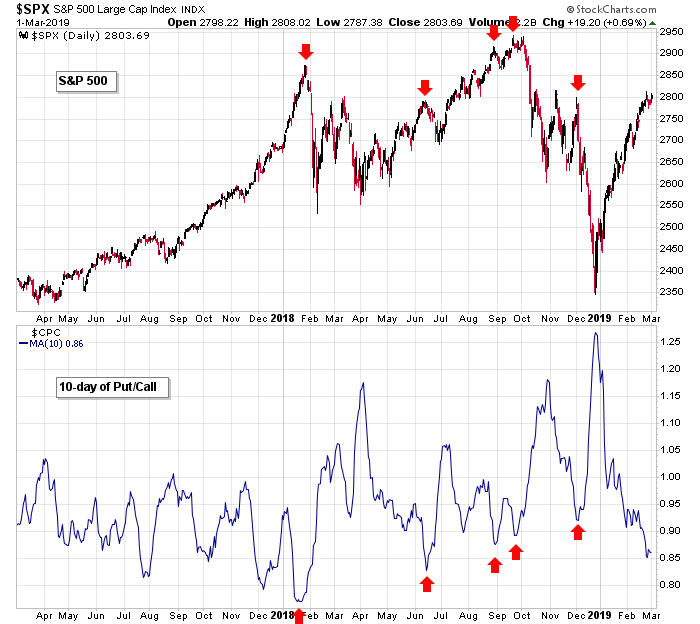
S&P 500 vs. Put/Call Ratio: Still no bottom for the 10-day put/call. A further decline supports more upside for the market.
The Bottom Line
The market is doing well overall. It has crossed a threshold and built itself a cushion to work with. Even if it corrects, the underlying strength tells us buyers will step in a support prices.
But near-term warnings are mounting. The down-trending number of stocks at a 20-day high is worrisome.
Let’s keep going, but we need to be more mindful of some near-term weakness. Have stops in place, and don’t fight with the market if it wants to do some backing and filling.
Have a great week.
Jason Leavitt
One thought on “LB Weekly (Mar 3)”
Leave a Reply
You must be logged in to post a comment.
Jason
Great read. I have to say you are spot on here.
Paul