Here’s an AMD day trade. My system is simple and can easily be duplicated, although traders will have to figure out the little nuances on their own.
—————
Not a Leavitt Brothers subscriber but appreciate our work? Consider making a small donation.
—————
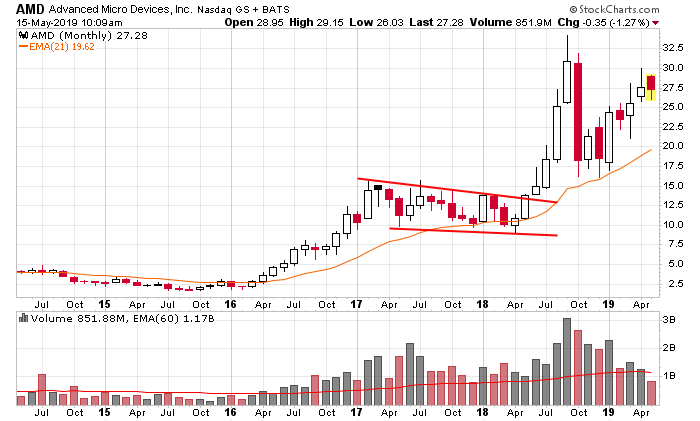
The monthly looked great. It’s a just a backdrop, but I do like to take a quick glance to verify that I’m trading in the direction of the long term trend. The stock had bounced off its monthly 21 EMA and had moved up the previous few months. Although 30% swings were normal.

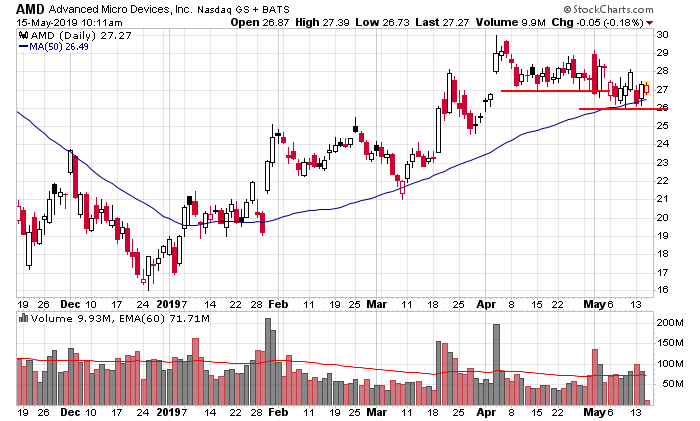
The daily suggested a sloppy picture. The trend was up, but there were a handful of big gaps. At the time of interest, the stock had taken out a support level at 27 but was establishing a new level at 26, the location of its 50-day MA. Knowing this would likely be strong, it gives me more confidence to go long.

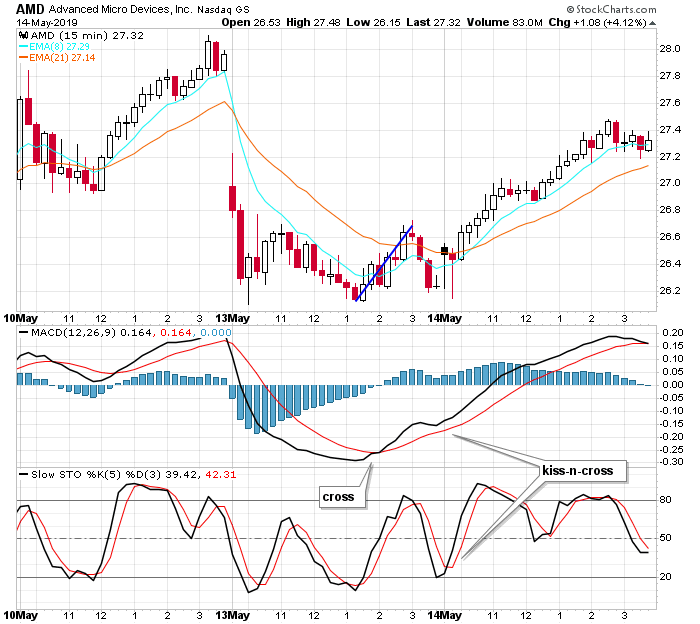
Zooming in with the 15-min chart, we got one of my favorite setups. On May 13 the stock matched it low from earlier in the day and bounced about 50 cents (blue line). This caused the MACD to cross up (shown). On the subsequent move down, the signal line merely came down and “kissed” the MACD while the Stochastic, which had rotated down, crossed up. This is my “kiss-n-cross” setup. The stock then rallied a point. Not bad for a 26-dollar stock.

—————
Join our email list – be alerted of new content.
—————
Related Content:
BLOG: MACD – Everything You Need to Know
BLOG: Stochastic – Everything You Need to Know