Leavitt Brothers Cyber Week Special — >> buy an annual subscription, get 3 months free.
That’s less than $40/month.
Simply sign up for an annual subscription, and we’ll add the extra 3 months.
Subscribe here.
———————————-
The market is in the midst of a minor drop. Will stocks quickly right themselves and rally into the end of the year, or suffer a bigger correction, suggesting the market just isn’t ready to break out and rally hard?
The indicators will guide us. They give us a look under the hood by acting differently in different market environments. Let’s run through a few that will helps us answer the above question.
The AD Line at the NYSE
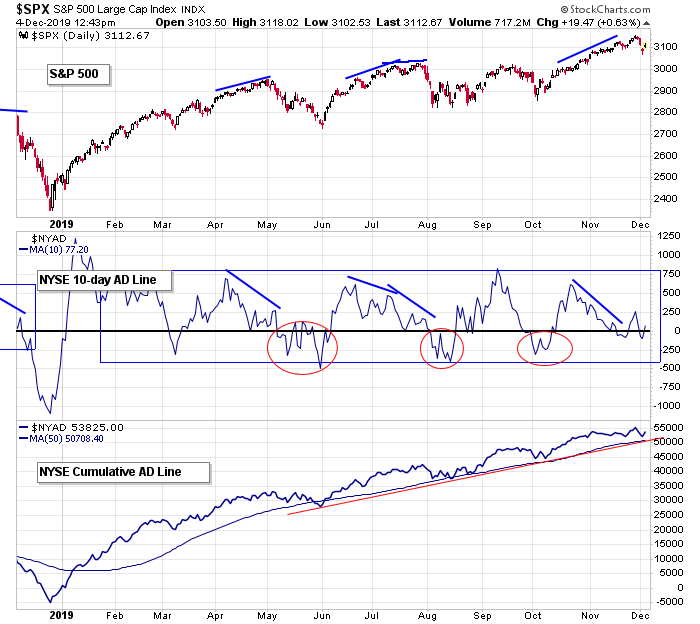
The cumulative AD line (bottom pane) continues to make higher highs and higher lows. This is my top, long-term indicator. As long as it trends up while only experiencing shallow dips, the market’s overall health should be considered up.
The 10-day of the AD line, which zooms in with the market’s current pulse and hints at the near term, is noncommittal. It formed a negative divergence, inducing the recent market drop, but now isn’t offering help. A dip below 0 and failure to quickly recover will lead to an extended pullback, lasting a couple weeks. A dip below the blue box would suggest a drop amounting to more than a minor drop is likely in order.
The AD Volume Line at the Nasdaq
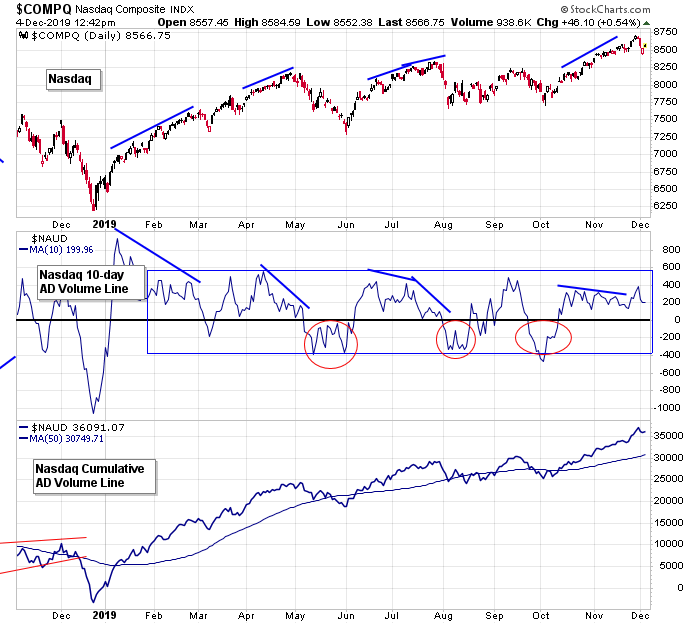
The cumulative AD volume line at the Nas is trending up and recently hit a new high. Check.
The 10-day is hovering in the middle of its positive range, offering support for the market’s trend. A negative divergence, where the indicator falls to 0, would be an issue. A drop below 0 that fails to recover would lead to a legit market pullback, but only a big move down would hint at anything more than a garden-variety “correction within an uptrend.”
Put/Call
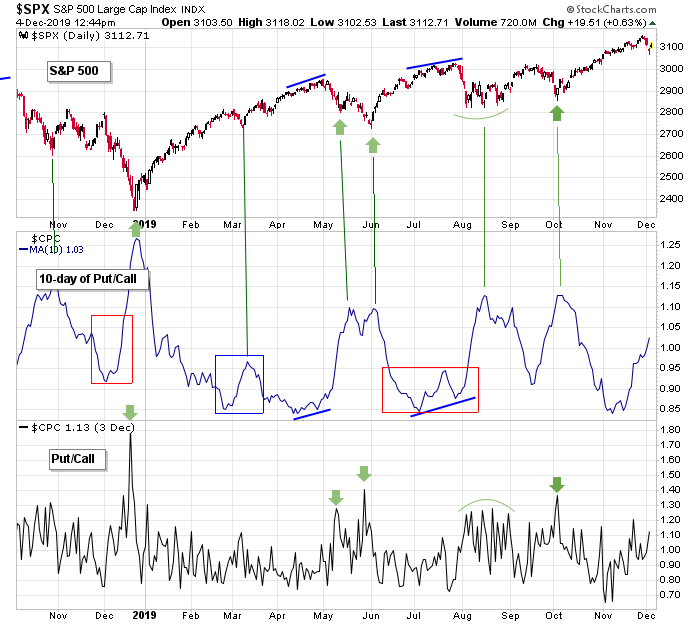
The 10-day put/call bottomed in mid-November, hinting a market top was likely in the works. Now that the indexes have dropped off, watch for the put/call to roll over to mark a market bottom. If the market tries to rally but the put/call continues up, the rally won’t go far.
The Percentage of SPX Stocks Above Their 20-, 50-, and 200-day Moving Averages
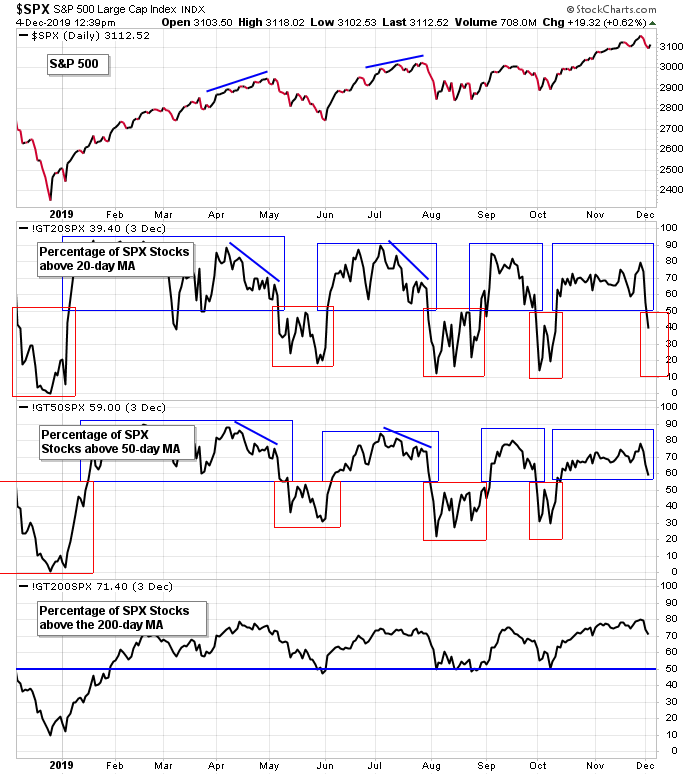
The percentage of SPX stocks above their 20-day MAs has dropped below 50%. If the indicator lingers down here, the market is headed down further. It can push higher for a short period of time, but the math won’t let it run while more than half the S&P is below their 20’s.
The percentage above their 50’s has dropped to a 2-month low, signaling declining support but not a dire situation. Sustained time below 55% would be an issue.
The percentage above their 200’s is just now coming off a new high. Long term, as long as this indicator stays above 50%, dips will be buyable.
Average True Range, Bollinger Band Width, VIX
Markets rally on declining or low volatility and drop on expanding or high volatility. Both the ATR and BBW dropped to levels consistent with previous lows, perhaps suggesting the calm, peaceful market may wake up soon. The VIX matched its lows of the year.
Rotating up is acceptable but extended rallies from these indicators would suggest something more than an innocent pullback is in the works.
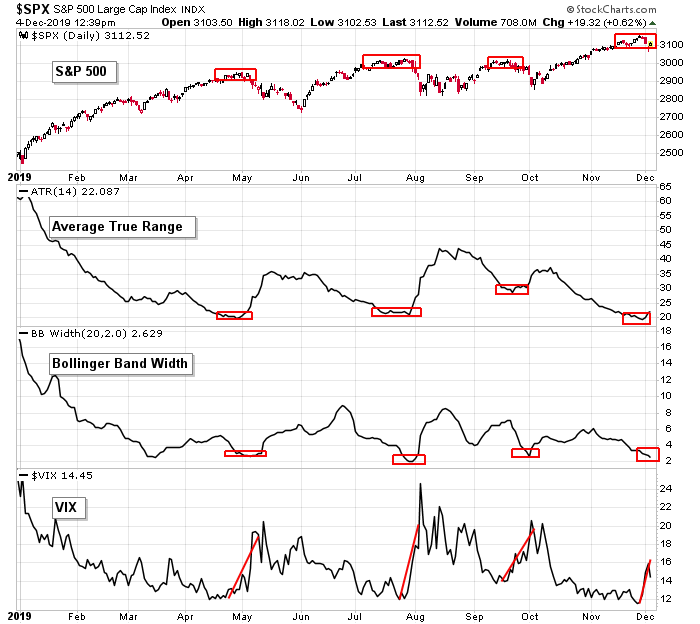
The market is pulling back. As of now, nothing suggests we’ll get anything more than a very normal pullback within an uptrend. It’s only if the indicators move to much more extreme levels that traders should get concerned the bull market will have a bigger interruption.
Happy trading
Jason Leavitt
3 thoughts on “Big Correction of Minor Dip?”
Leave a Reply
You must be logged in to post a comment.
I have never been able to calculate tops. It is not for lack of effort. I must assume traders and investors buy the dips based some sort of logic since I have been able to calculate bottoms with some precision. When people stop buying at peaks has little predictability. News events often drive selling.
Right now I am looking to go long when the NASDAQ drops to 8300.
I see Jason has been looking at PC ratio. Nice work!
As far as I know the put/call ratio does not differentiate between the buying and selling of puts or calls. Hence you really want to plot the put/call open interest ratio.
Great presentation!