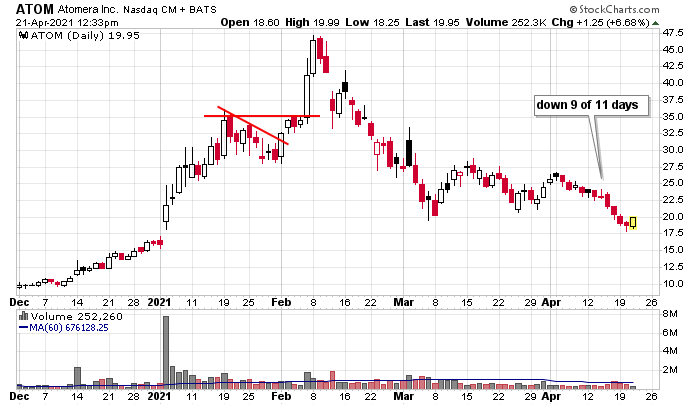
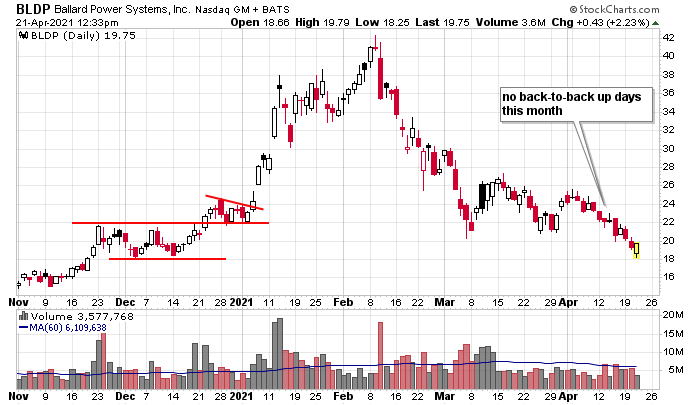
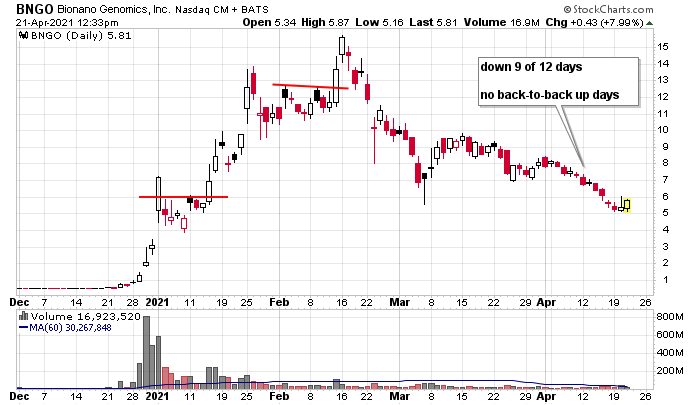
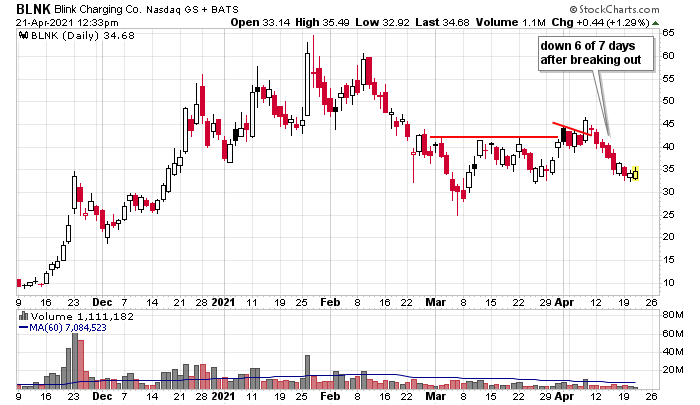
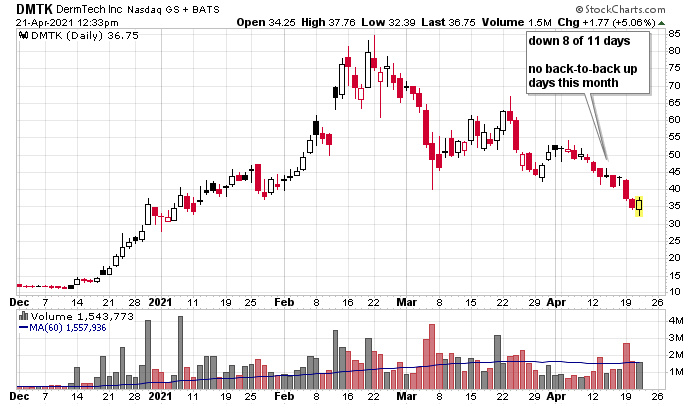
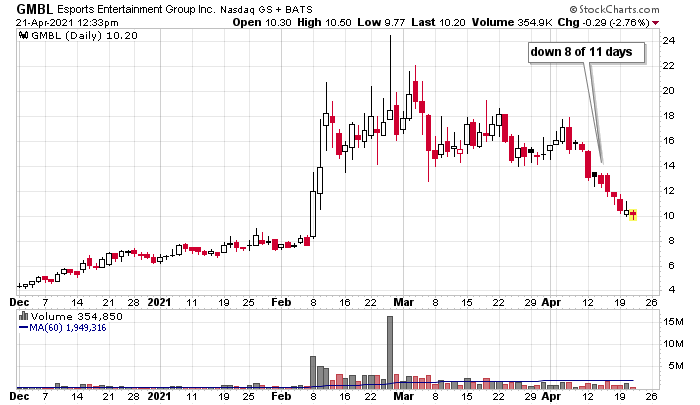
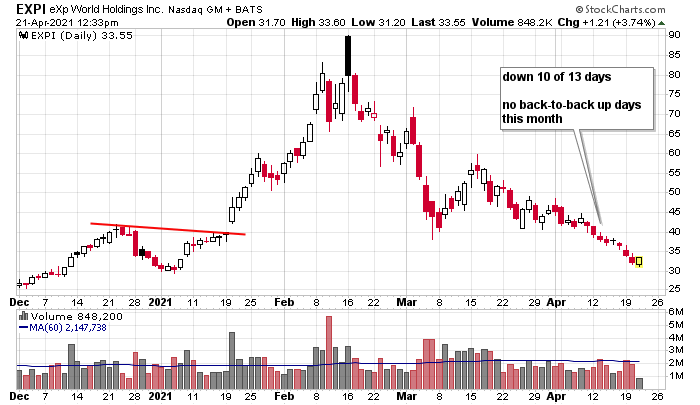
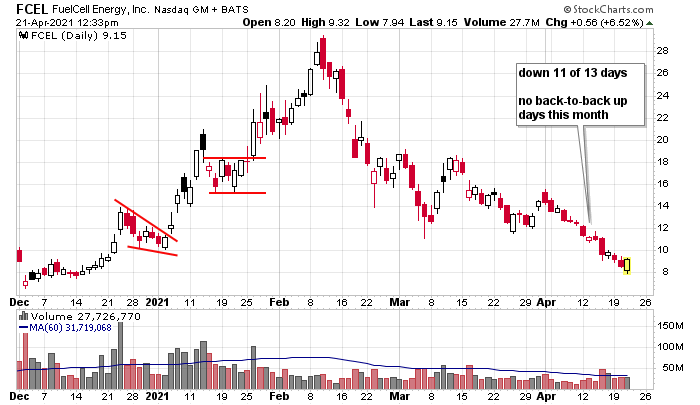
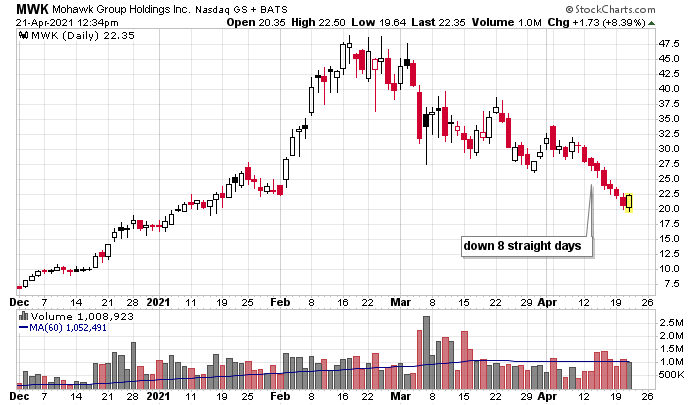
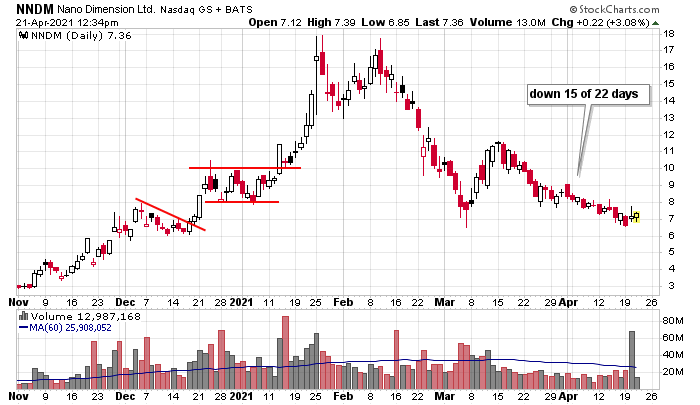
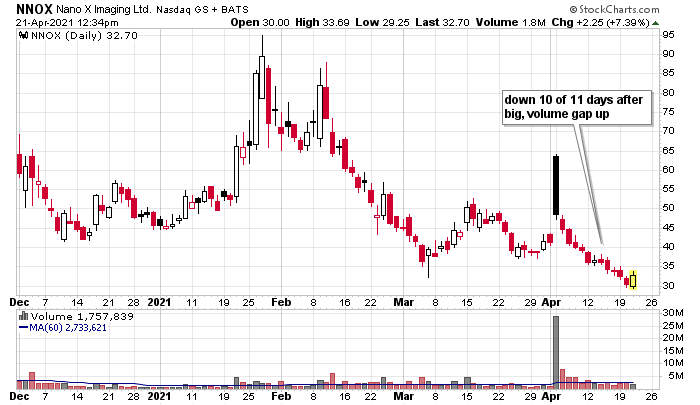
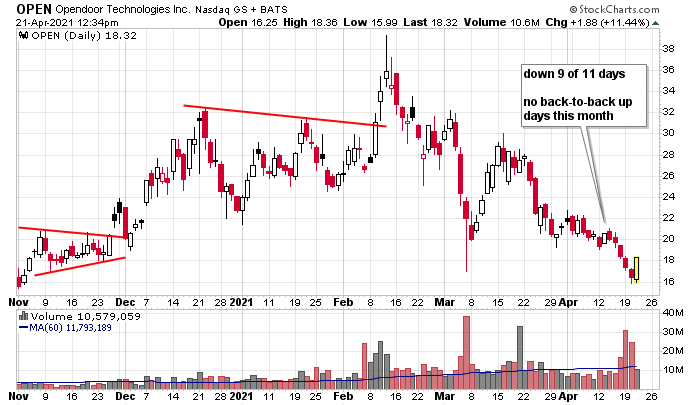
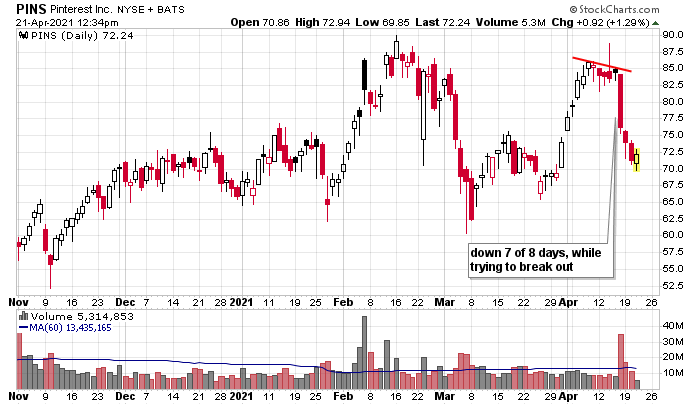
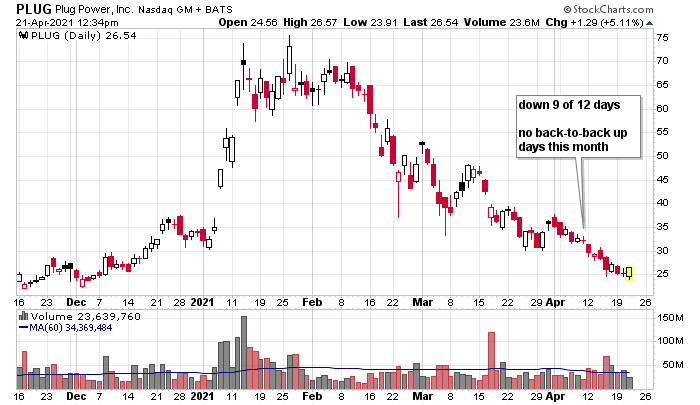
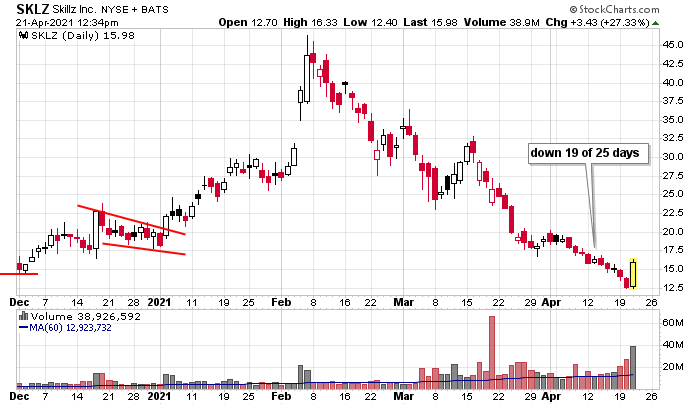
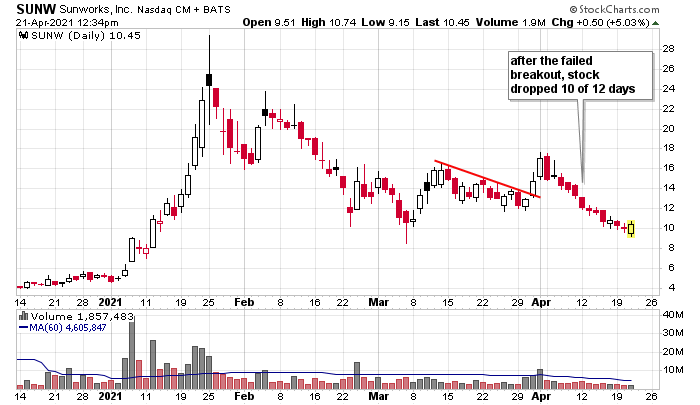
In my opinion, it’s because of the steadiness of the selling pressure. Stocks aren’t alternating between dropping and popping and posting losses over time. They aren’t dropping 3-4 days and then rallying 2-3 days and posting losses overall. Instead they are just relentlessly selling off.
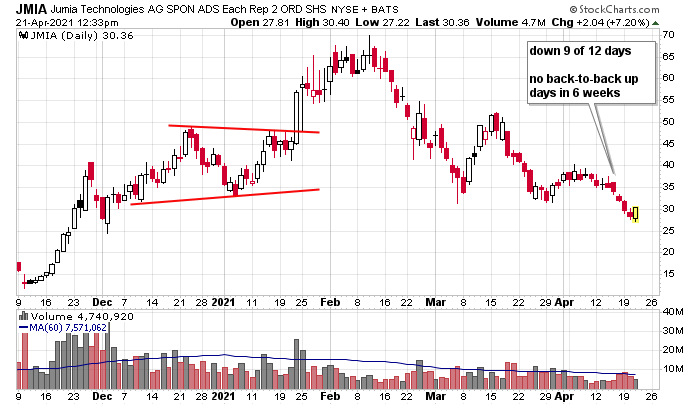
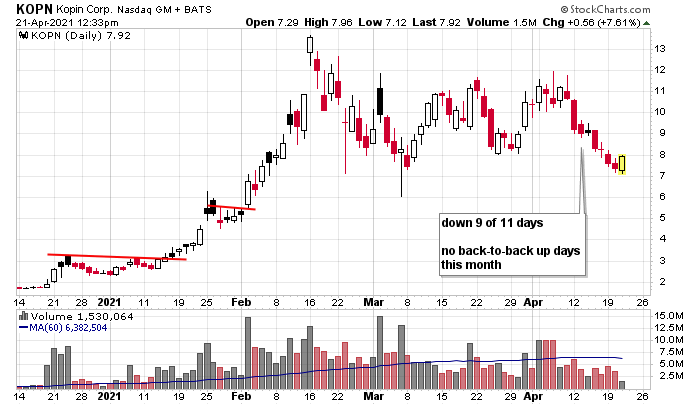
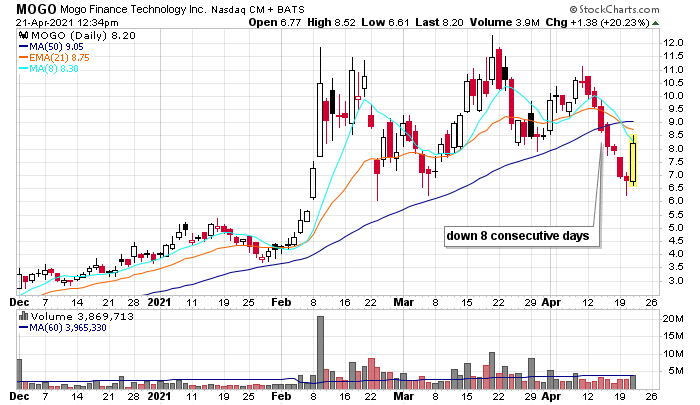
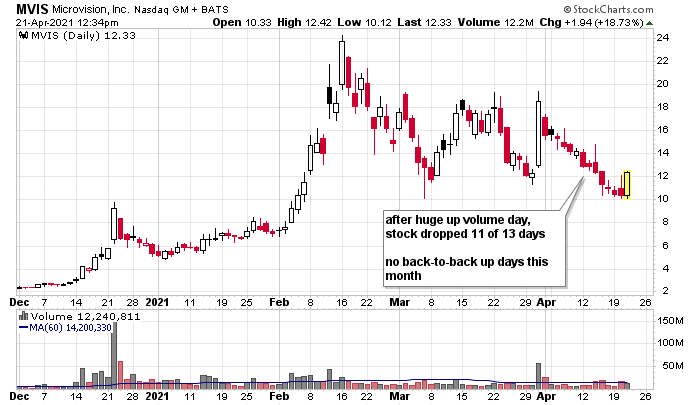
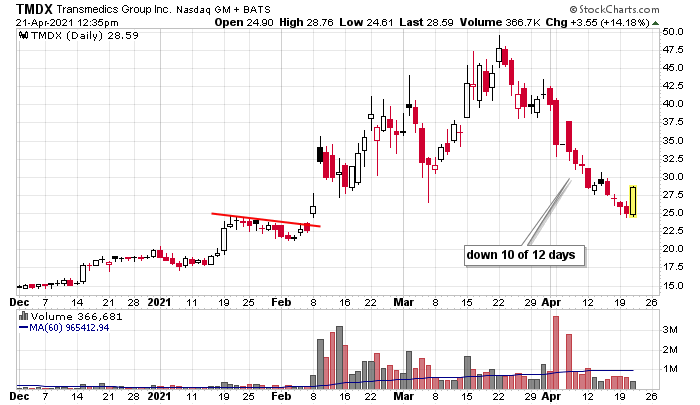
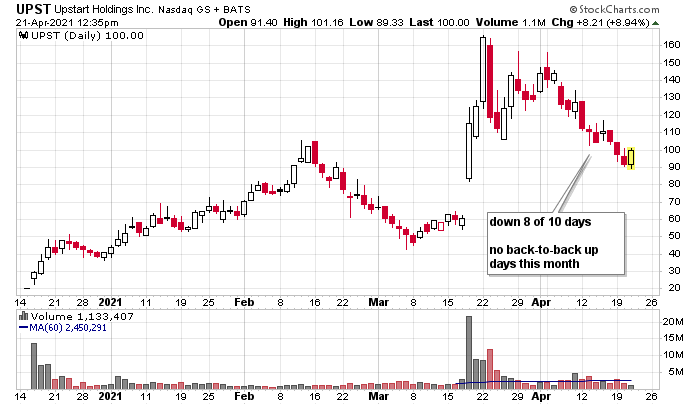
This means if you want to exit a position and are waiting for a bounce, you end up taking a big loss because there haven’t been any bounces. Or if you’re waiting for a bounce to go short, you never got an entry because there have been almost no back-to-back up days. Many stocks have literally dropped 10 of 12 days and haven’t posted consecutive up days in several weeks. Below is a list of stocks that have given traders no second chances.
I talk about recognizing the market’s personality and making adjustments in my masterclass. Check it out. It could be a game changer for you.
Good luck. Join our email list and get write-ups like this sent directly to you.
Jason Leavitt
Great info you provided above.
I have gone from losing #3-$5K (PLUG one of them) on some of the stocks in my portfolio to the biggest loser today was VIR ($214.40) at the time I’m writing. Most of my portfolio is in BioTechs and Alt energy & EVs. So, is the blood letting in these sub-sectors over? Would they still go down 10% or more? What ppl smarter than me are thinking?
All a matter of perspective. I have had the best 6 weeks in years. This market is golden.
PS I only trade leveraged index ETF’s. Buy at the bottom and sell at a profit.
I’m doing something similar. Looking for the strongest 2x and 3x ETFs
BRZU is one good example. It made a bottom early March. And now it’s made two higher lows and broke above resistance a few days ago.
I have no idea if the chart will post.
https://stockcharts.com/h-sc/ui?s=BRZU&p=D&yr=0&mn=10&dy=17&id=p61812314804&listNum=2&a=870675176
MEXX is another nice example.
https://stockcharts.com/h-sc/ui?s=MEXX&p=D&yr=0&mn=10&dy=17&id=p37439924471&a=870678316&listNum=2
Pete nice charts.
Nice work daddypaul. What have you traded?
Traded mostly TQQQ and Some SOXL.