The market is doing moderately well. The S&P and Nas are near multimonth highs, and the Russell 2000 is basing. All are positioned to break out and attempt to run higher.
But breadth is lagging. Participation lately has not kept up with the progress from the indexes. Let’s dig into the numbers. How many stocks are at 5-day, 1-month and 3-month highs, and now many stocks are above their 5-day, 20-day, 50-day and 200-day moving averages?
Stocks at New Highs
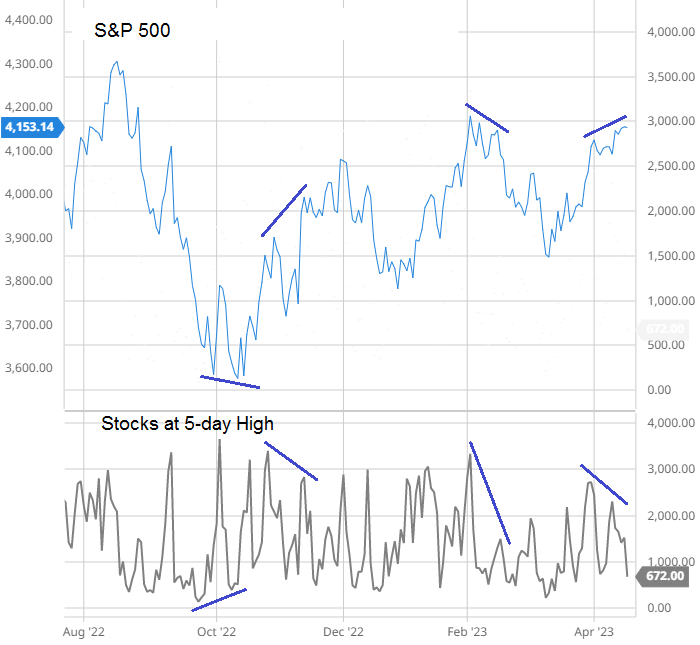
S&P 500 vs All Stocks 5-day Highs: A 5-day high is not a high bar to cross, especially when the market does well. Yet, the number of stocks printing a 5-day high to end last week couldn’t match the late-March number or several prints from November, December and January. A negative divergence is forming. Many stocks are not participating in the current uptrend.
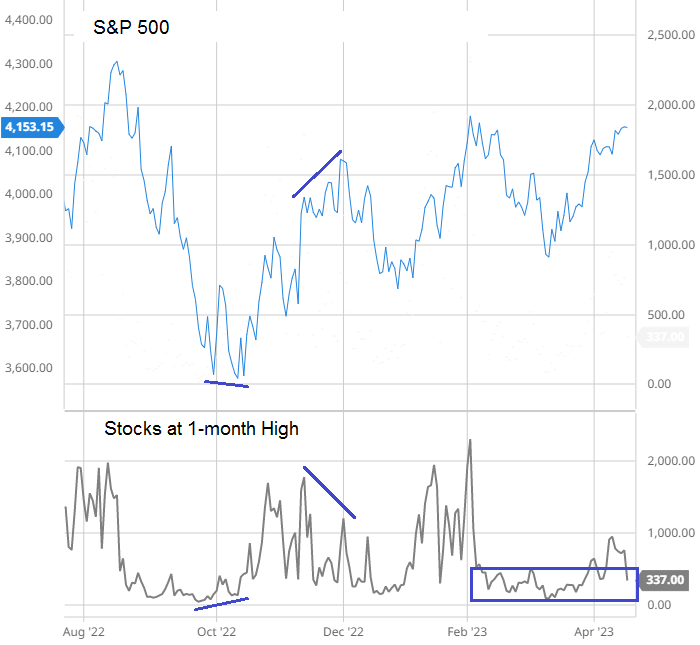
S&P 500 vs All Stocks 1-month Highs: Stocks printing 1-month highs have been steadily improving and are currently at their highest level since early February. The bulls can cheer the progress, especially after the March drop came with significantly less stocks above their 20’s than the December drop.
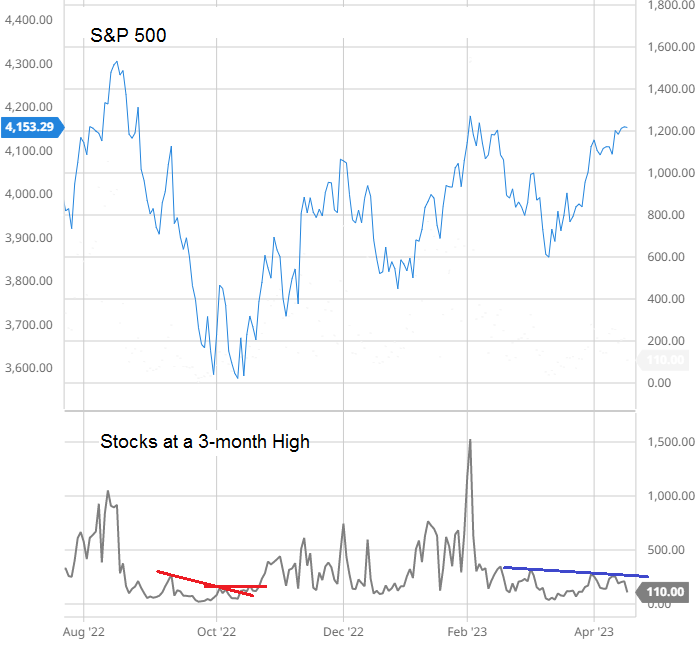
S&P 500 vs All Stocks 3-month Highs: The market itself is not at a 3-month high, so we shouldn’t be surprised the number of stocks at a 3-month high has been muted. If the print can breakout, there’ll be a very good tail wind at the market’s back. That was the thinking coming into this week, but the print has dropped further off resistance.
Stocks Above Moving Averages
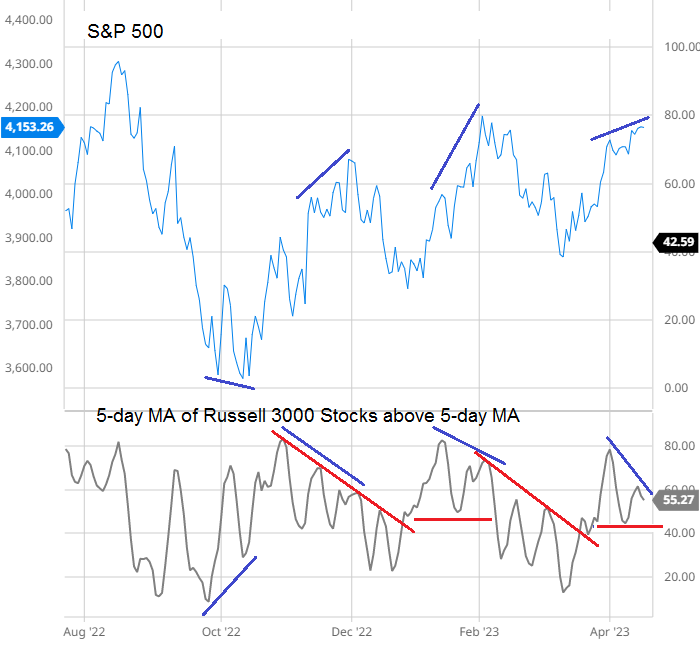
S&P 500 vs 5-day MA of Russell 3000 Stocks above their 5-day MAs: Russell 3000 stocks above their 5-day moving averages dipped back to their previous breakout level and then tried to move up. A negative diverge is forming, suggesting less stocks are coming along for the ride. Divergences have marked many reversals.
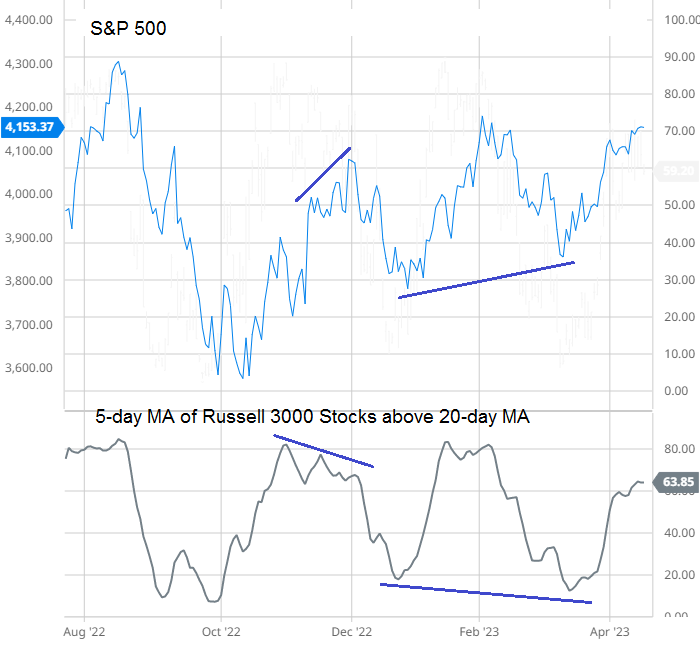
S&P 500 vs 5-day MA of Russell 3000 Stocks above their 20-day MAs: Russell 3000 stocks above their 20-day MAs continue to expand. The print is good and trending up, with room for improvement. There’s still meat on the bones.
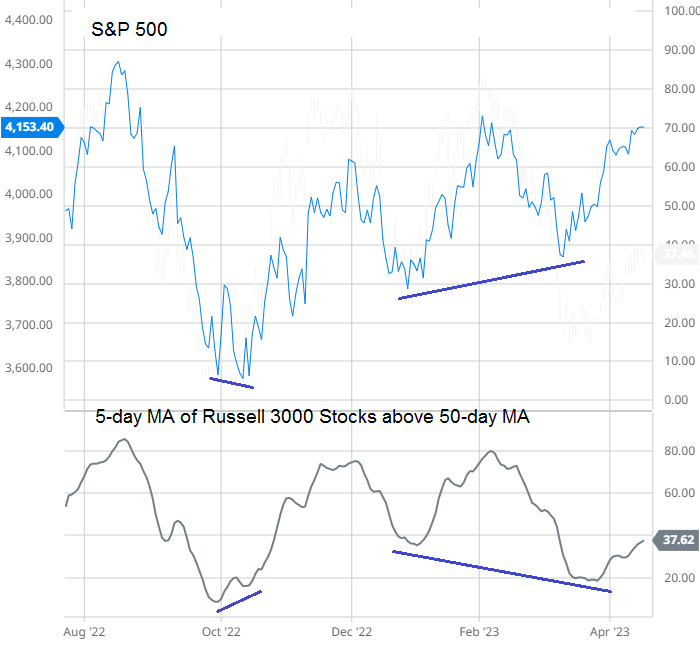
S&P 500 vs 5-day MA of Russell 3000 Stocks above their 50-day MAs: Stocks above their 50’s have been lagging. The current print is no better than the October print, when the market was 2 weeks off its low. Six months later and 600 S&P 500 points higher, the same number of stocks are above their 50’s? This is okay in the near term, but it won’t support a lasting rally.
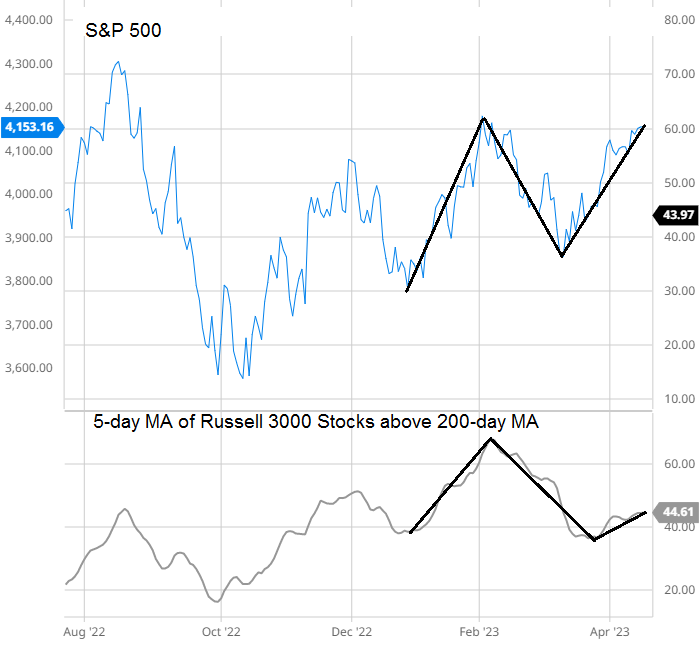
S&P 500 vs 5-day MA of Russell 3000 Stocks above their 200-day MAs: Stocks above their 200’s paint a more obvious warning. The rally into the February high had more than two-thirds of stocks above their 200’s. Since then, the market has dropped and recovered, but stocks above their 200’s dropped further and flat-lined. Many stocks have been left behind.
Despite the indexes being in decent shape, there’s a lack of support beneath the surface. I question the market’s ability to run higher right now.
Jason Leavitt
Paid Service: https://www.leavittbrothers.com/videos/LBoverview.cfm
Masterclass: https://www.leavittbrothers.com/masterclass.cfm
email list: https://www.leavittbrothers.com/email-subscribe.cfm
twitter: https://twitter.com/JasonLeavitt