A point I’ve made dozens of times over the years is: The market moves up on low or declining volatility and down on high or increasing volatility.
Volatility can be measured in several ways. Some use the VIX. There’s also meaning behind the put-call ratio. I prefer the average true range because it’s a simple measure of how much stocks move.
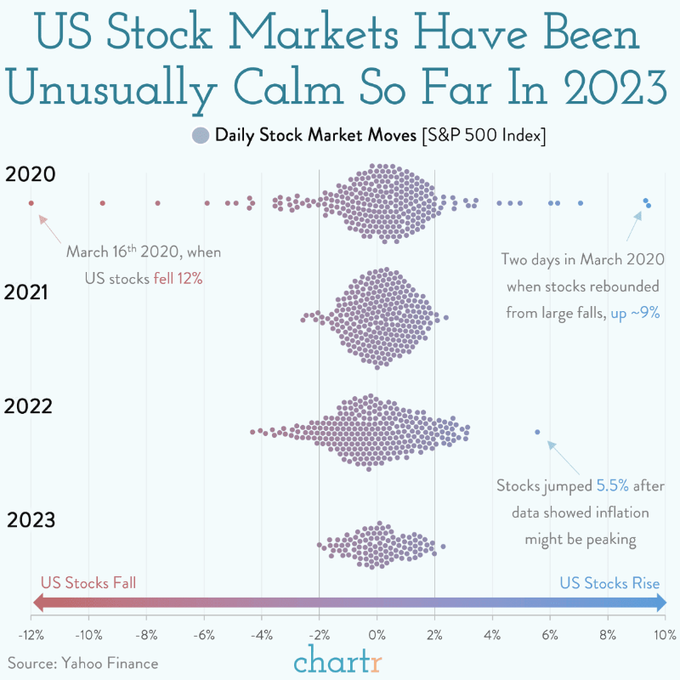
Here’s an image which shows the daily moves of the S&P 500 for 2020, 2021, 2022 and so far this year.
2020 was the COVID year. There are many outliers in both directions – big single-day gains and big single-day losses.
2021 was a fantastic up year. There were very few individual days where the S&P moved more than 2%. The lack of big days, the lack of volatility, confirmed the uptrend.
2022 was flatter in terms of the distribution. There were dozens of days that were +2% or -2% and possibly upwards of 100 that were +1% or -1%. The distribution of day-to-day gains and losses told us the market was weak.
2023 looks most like 2021. We are halfway through the year, and there are only a couple data points at the +2% and -2% extremes. The absence of big days is telling. Remember what I’ve said: In an uptrend, good days are good and bad days are bad, but in a downtrend, good days are fantastic and bad days are terrible.
2023 is acting like a healthy market. Until proven otherwise, we’d be wise to maintain our bullish bias and keep plugging away.