On the surface, the market is doing great. Several indexes have printed new highs recently, and tech is leading the charge. But beneath the surface, the market is thin. Participation is not good. The market gains are not supported. The advance-decline line leans down; the high-low on various lookback periods are trending lower; and stocks above various key moving averages have been declining. Let’s review.
Advance-Decline Lines
S&P 500 vs 10, 20 and 50-day Moving Average of the NYSE AD Line: On all lookback periods, NYSE advancers are leading decliners by a smaller margin than a month ago. The 10-day print isn’t bad, but considering the S&P’s all-time high, it’s not great. And the 20 has been lifeless all month. Negative divergences are forming on all time frames.
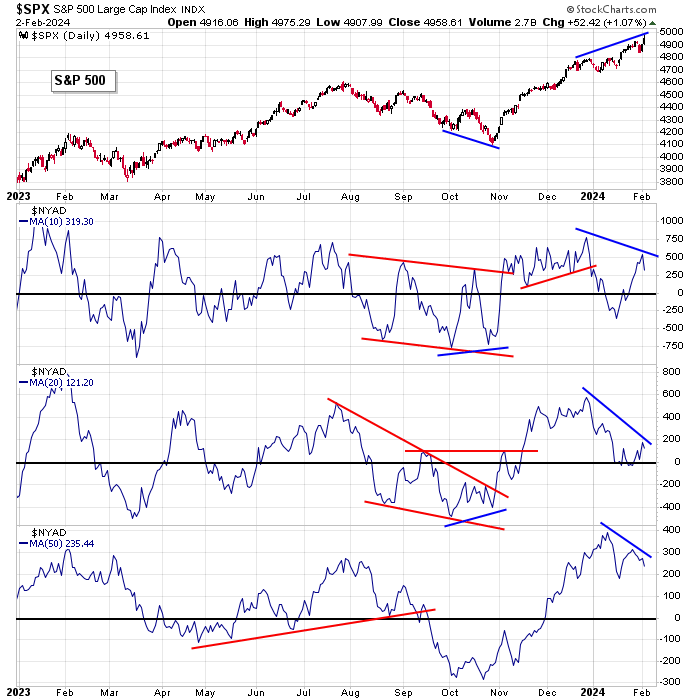
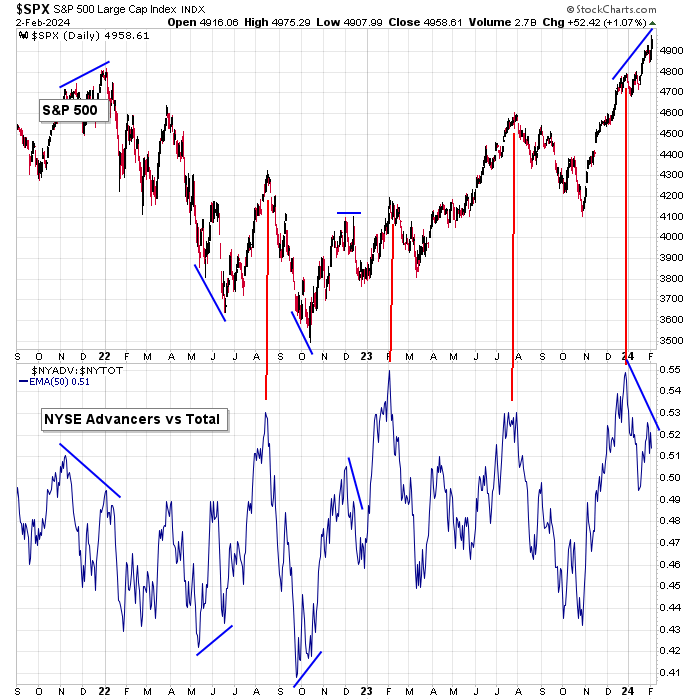
S&P 500 vs 50-day Moving Average of NYSE Advancers vs Total Stocks: This is a different look at the AD data, but it paints the same picture. As the market moves higher, less stocks have been advancing each day.
New Highs and New Lows
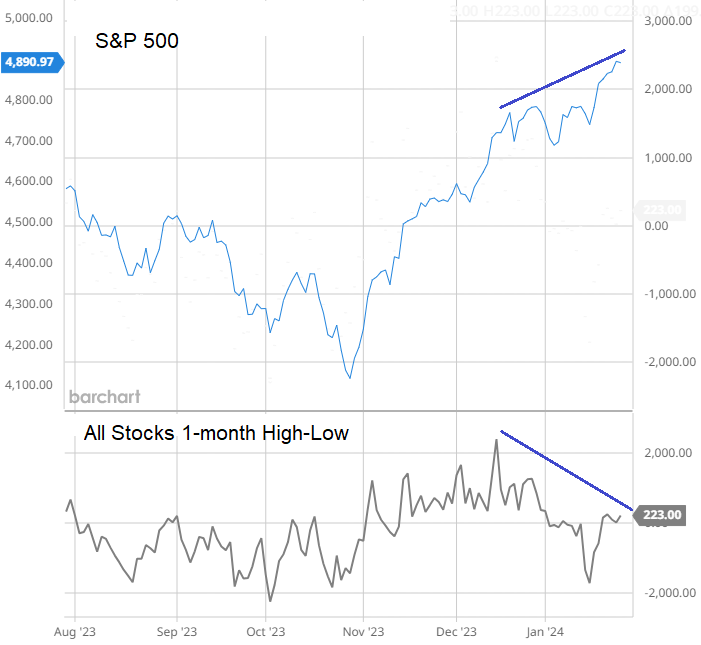
S&P 500 vs All Stocks 1-month High-Low: The S&P is at an all-time high, but the 1-month high low was only 223 Friday. The market is being pulled higher by a small number of out-performers.
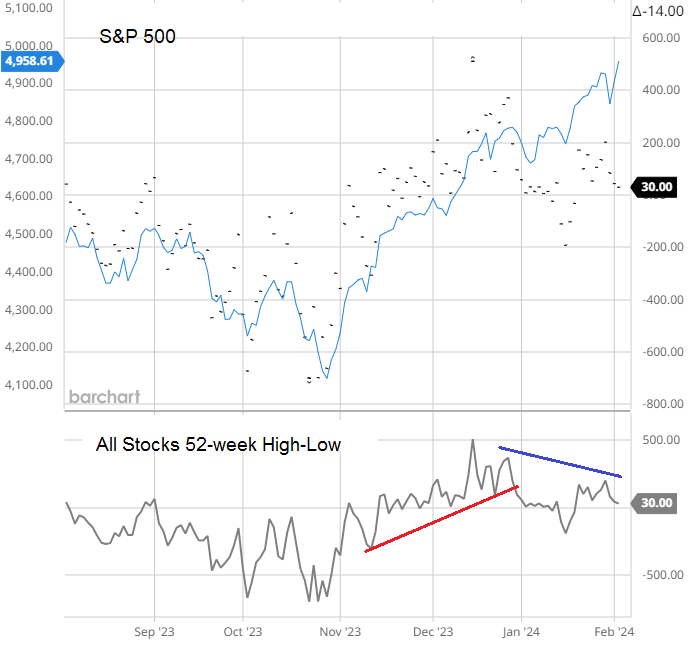
S&P 500 vs All Stocks 52-week High-Low: Broken record. The S&P is at an all-time high, but not many stocks are printing new highs vs new lows. Participation is not good. The internals have not improved.
Stocks Above Moving Averages
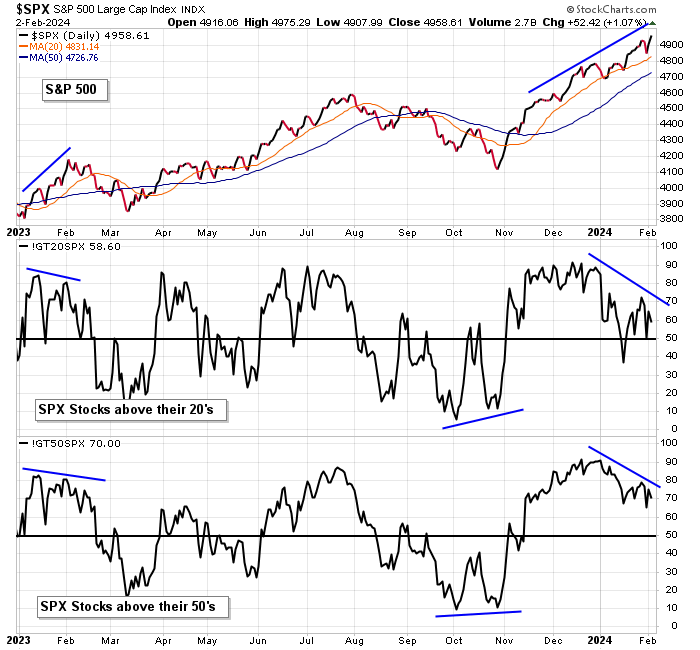
S&P 500 vs SPX Stocks above Their 20 and 50-day MA’s: The S&P has steadily trended up and is easily above its 21 and 50-day moving averages, but the percentage of SPX stocks above their 20 and 50-day MA has declined. Stocks above their 20’s has declined from 90% to 65%, and stocks above their 50’s has dropped from 90% to 75%. Less stocks are participating as the rally has extended.
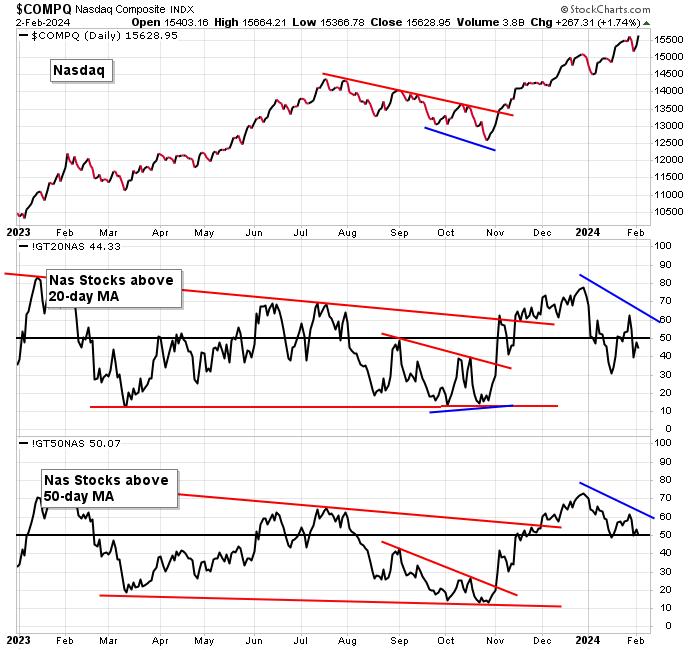
Nasdaq vs Nasdaq Stocks above Their 20 and 50-day MA’s: Nas stocks above various moving averages will always lag because a lot of junk trades at the Nas, but relative prints are telling. The Nas nearly matched a previous high last week, but like the S&P above, less stocks were above their 20 and 50-day moving averages. Stocks above their 20’s dropped from 54% to 44%, and stocks above their 50’s dropped from 58% to 50%.
Overall bias is to the long side, but stops must be in place. A lot of negative pressure is building. We can get stiff move down at any time.