March is over, so we got the end of the month and quarter at the same time. With this, numerous studies completed and triggered that look out to next month and the rest of the year. Let’s go through some. History doesn’t always repeat, but if conditions point to high odds of gains, we’d be wise to keep that in the back of our minds.
According to Ryan Detrick, the S&P was recently up 27% over the previous 21 weeks – the best 21-week run in history. There were six other times the index was up 25% in 21 weeks, and in each case, the S&P posted a gain a year later. The average was 21%. Add 21% to the current level, you’re talking about SPX 6300.
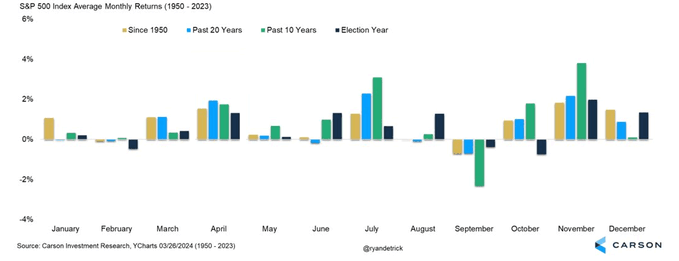
April is the last month within the “best 6 months of the year” (November-April). Over the last 10 years, 20 years and all years since 1950, April has been one of the best months, including during election years. (Detrick)
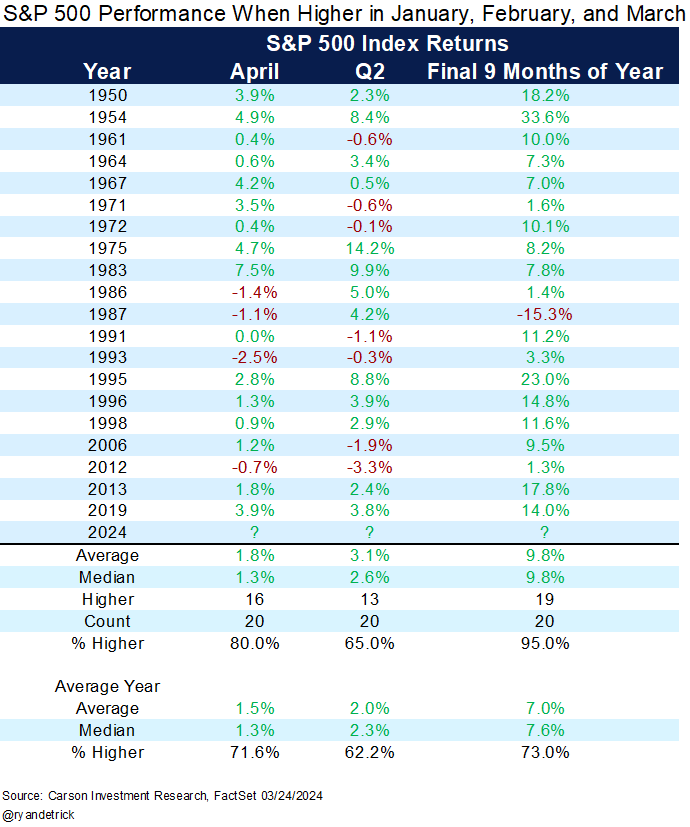
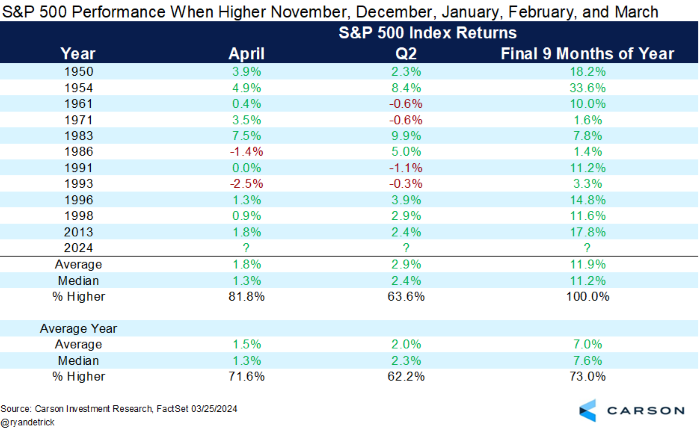
The S&P gained 1.6% in January, 5.2% in February, and 3.1% in March. When the index has posted a gain in each of these months, April has been up 80% of the time (compared to 72% for all years), with an average gain of 1.8%. Things do cool after that, with the Q2 win rate only being 65%, but then things ramp up again. The final 9 months have a 95% win rate (vs the all-years average of 73%) and an average gain of nearly 10%. (Detrick)
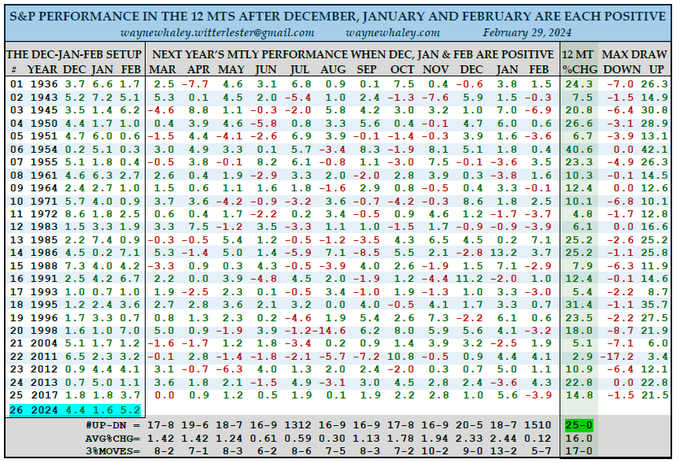
Slightly changing the months, when the S&P is up December, January and February, the index is up all 25 times 12 months later, with an average gain of 16%. (Whaley)
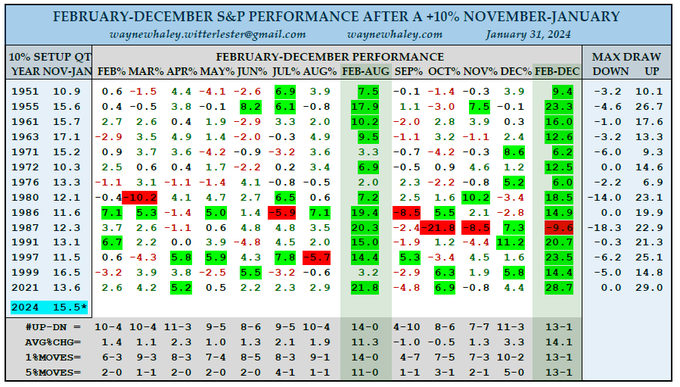
Slightly changing the months and criteria again, when the S&P is up 10% during November-January, the S&P is 14-0 with an average gain of 11.3% six months later and is 13-1 with an average gain of 14.1% 12 months later. The only black mark is 1987. Here are the numbers. (Whaley)
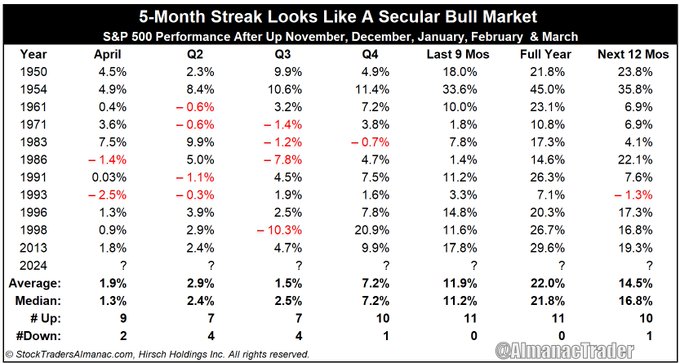
Backing up, November and December posted gains too, so we’re on a 5-month win streak. Historically, April’s gain and the Q2 performance don’t change compared to when only January, February and March post gains, but looking at the final nine months of the year, the win rate moves to 100%, and the average gain is nearly 12%. (Detrick)
And here are the numbers for April, Q2, Q2, Q4, the final nine months, and the entire year. (Traders’ Almanac)
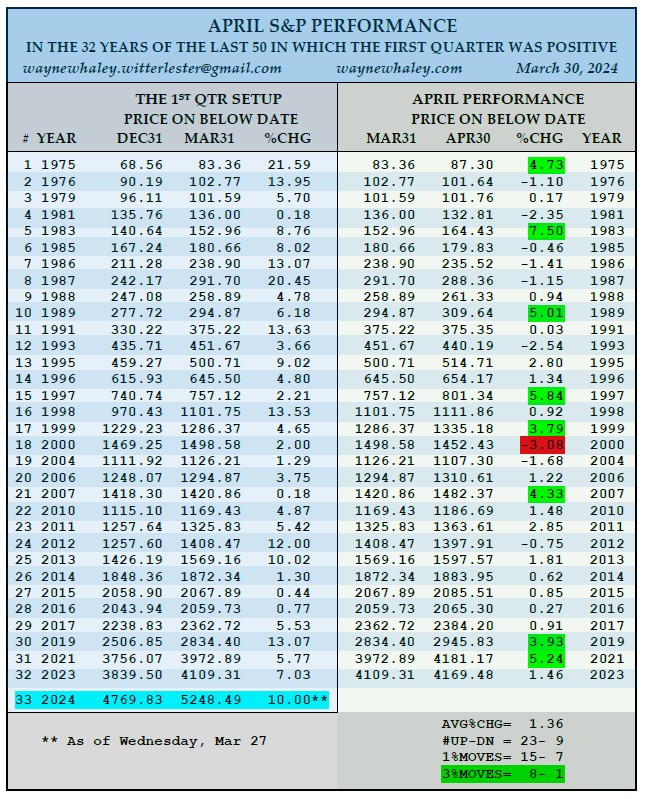
April is already a great month. With a 36-14 win-loss record the last 50 years, it’s tied for the best month of the year (per this metric). When the S&P is positive during Q1, April is positive 23 of 32 times, with an average gain of 1.36%. And the 3% monthly moves are 8-1 in favor of the upside, so there are many more surprises to the upside than downside. Here are the numbers. (Whaley)
When the S&P gains more than 5% during Q1 and finishes the quarter at an all-time high, the rest of year is up 13 of 15 times, with an average gain of 11%. This year the S&P was up 10.2% in Q1.
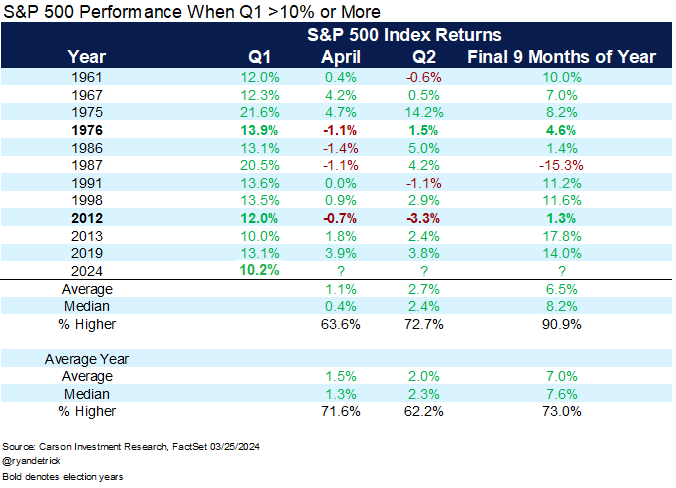
When the S&P gains more than 10% during Q1, April and Q2 are so-so, but the final 9 months have been up 91% of the time, with an average gain of 6.5%. (Detrick)
On March 21, 118 S&P stocks printed new highs. That was the most in three years. The last 13 times there were 118 new highs, the S&P was higher a year later every time, with an average gain of 12%.
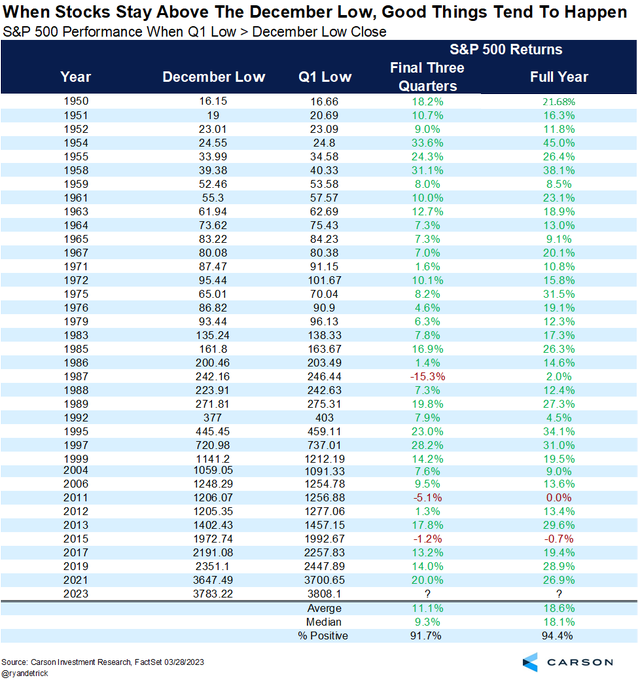
The December SPX low was 4546.50. The Q1 low was 4682.11 (hit in early January). Historically, when the S&P stays above the December low during Q1, the final three quarters are up 92% of the time, with an average gain of 11.1%. (Detrick)
According to Jason Goepfert, when the S&P goes 100 days without a 2% pullback, it has a 100% win rate six months out, with a 6.8% median return.
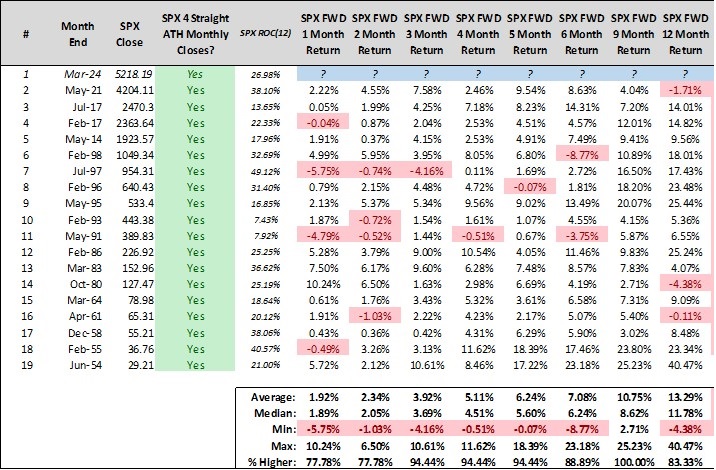
The S&P finished March at an all-time high (monthly close). This is the 4th straight month. Previous occurrences have seen lots of gains looking out multiple time frames. Six and 12 months later, the S&P is up 89 and 83% of the time, with average gains of 7.1 and 13.3%. Here are the numbers. (Deppe)
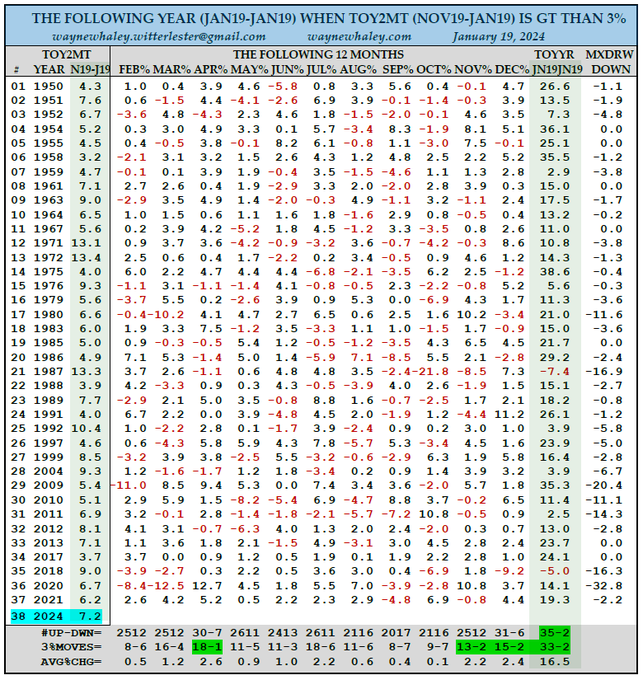
And this is all on top of Wayne Whaley’s TOY Barometer, which was positive this year. The gain from November 19 to January 19 was 7.22%. When better than 3%, the next year (Jan 19 – Jan 19) was 35-2, with an average gain of 16.5%.
If history repeats, odds favor higher prices 6, 9 and 12 months out. There’ll be some softness somewhere along the way, but the net going into the end of the year and early next year should not only be positive, but very attractive.
But keep in mind I’ve presented average data going forward. If the average is 10%, there are 1 and 2% years and 20% years. The standard deviation is big, so don’t get fixated on the average. The rest of the year can be much better or worse than average.
Still, when a dozen studies point to high odds the market is solidly higher on December 31 than it is now, we’d be wise to listen. And if you want to hope for a summer dip that allows for entries at lower levels, you can do that too. lol