May is the first month of the “worst 6 months of the year,” and history says if the month does well, it bodes well for the rest of the year and into the following year.
The S&P finished with a 4.8% gain, and several occurrences during the month triggered studies which not only point to the market being higher the last seven months of the year, but also well into 2025. Let’s go through them.
Here’s the monthly chart going back 4+ years. The S&P printed a new high in May and closed at a new high on a closing basis.
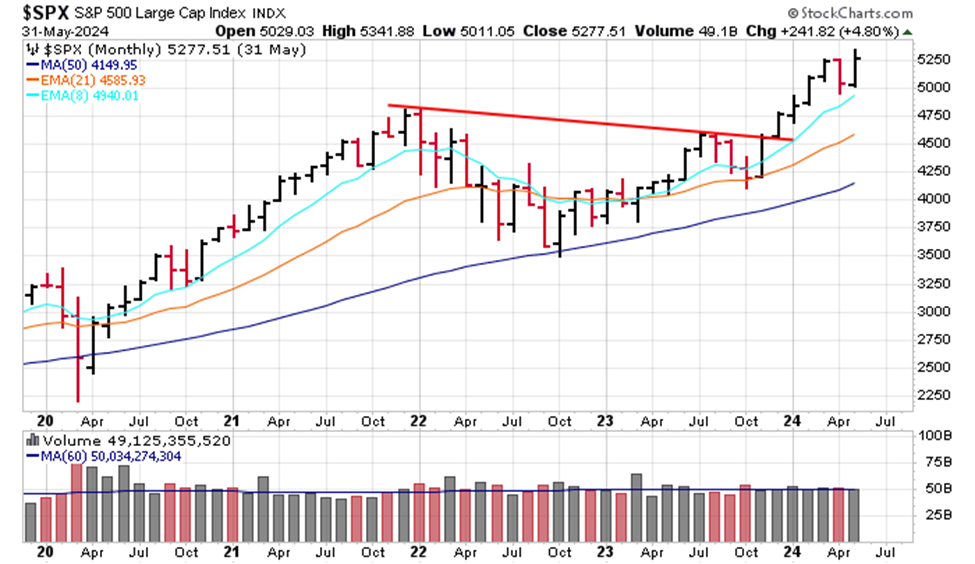
When the S&P prints a 12-month high during May, the rest of the year tends to be very good.
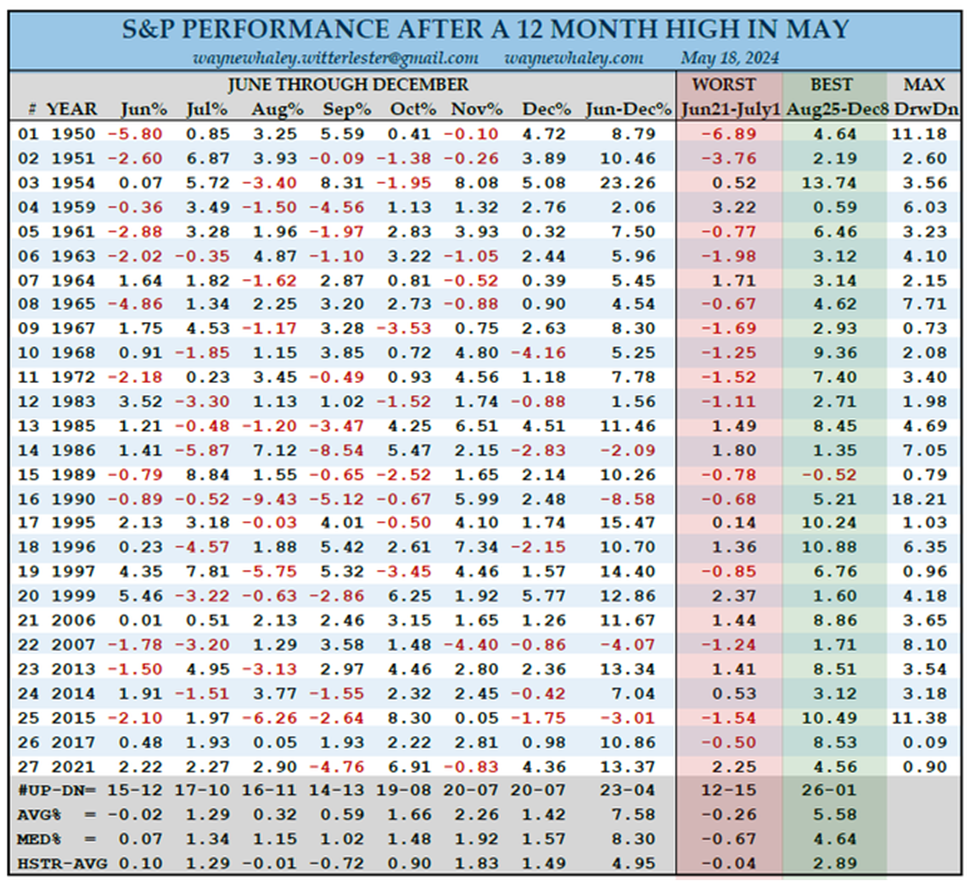
June is not so good, with a 15-12 record and a flat average performance. July is better, but August and September are bad. Then things get better. October, November and December are very good, and the net of the final seven months is 23-04, with a 7.58% average gain.
The worst period is June 21 – July 1; it’s 12-15, with a loss of -0.26%. The best period is August 25 – December 8, which is 26-1, with a gain of 5.58%. And, of course, I wouldn’t be bringing this to your attention if a new high wasn’t printed in May. (Whaley)
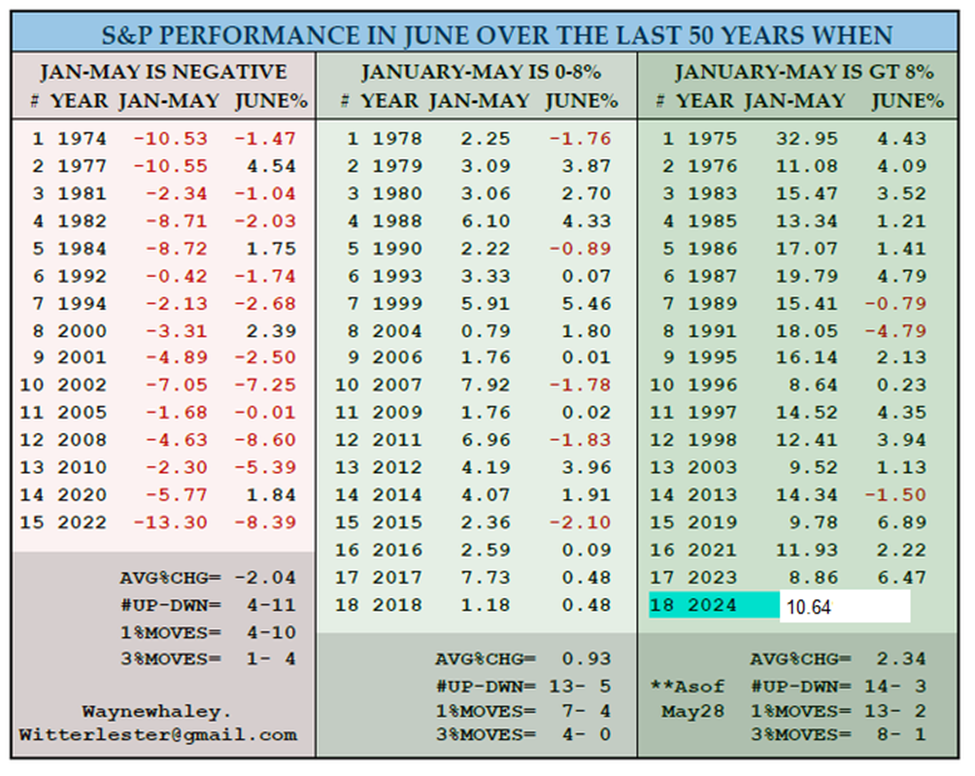
June tends to go well when the market does well into the end of May. In this table, June’s performance is shown, grouped by whether the year-to-date gain at the end of May was negative, positive (but not more than 8%) and up more than 8%. This year, the S&P was up 10.64% at the end of May, which puts in firmly in the third group. June is 14-3, with an average gain of 2.34%, with most of the big moves favoring the bulls. (Whaley)
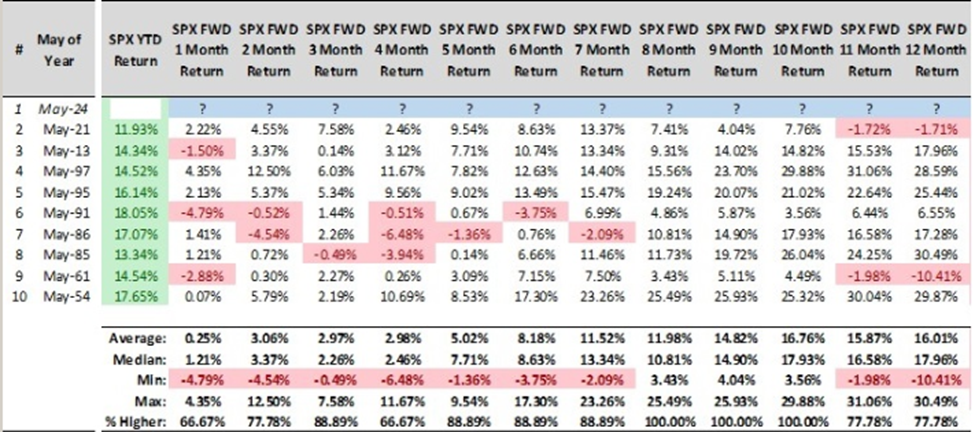
When the S&P closes at a new 12-month high in May and year-to-date the market is up 10%, the S&P is up most of the time looking out 6, 7 and 8 months, and it’s up 100% of the time 8, 9 and 10 months later. (Deppe)
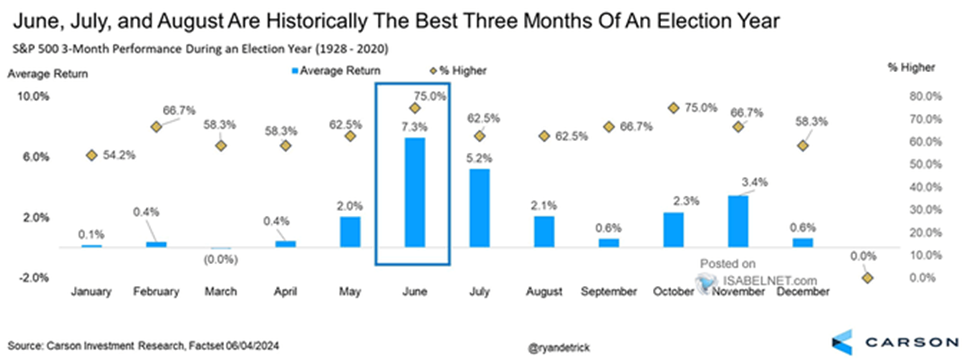
June tends to do well during election years anyways, regardless of May. (Detrick)
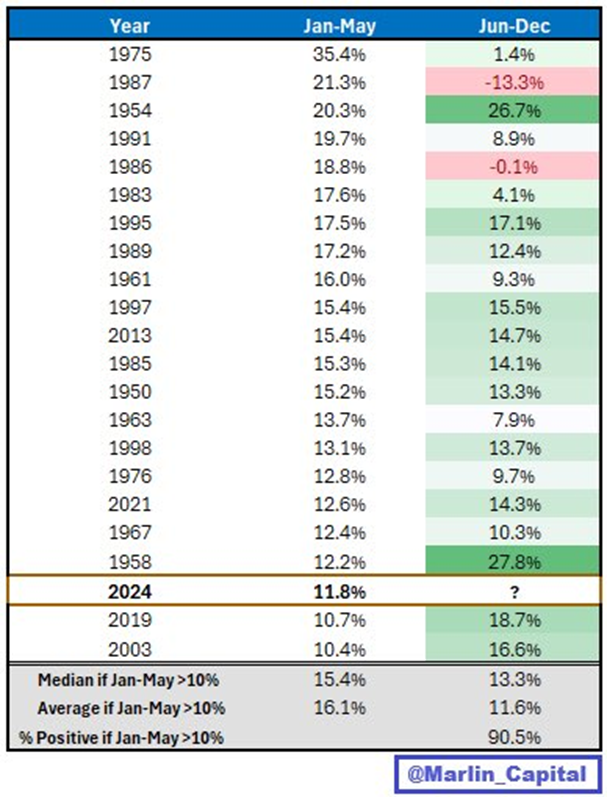
And when the S&P is up 10% at the end of May, the rest of the year tends to be very good, with a 90.5% win rate and a 13.3% average gain. (Marlin Capital)
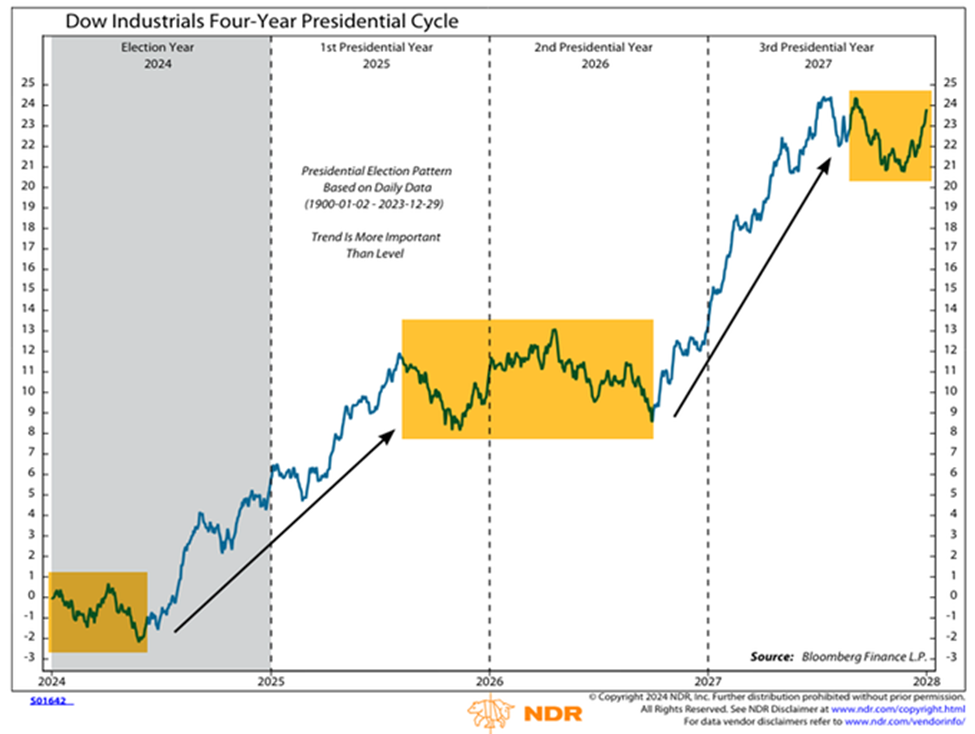
These studies can be added to the list we already have. Regardless of what happens this summer, odds heavily favor the market doing well during Q4 and into 2025. And this fits with history. Here’s the average path of the Dow during the presidential cycle. A rally from the middle an election year to the middle of the following year is in line with history. (NDR)
Good Luck.
Jason Leavitt
Paid Service:
https://www.leavittbrothers.com/videos/LBoverview.cfm
Masterclass – the mechanics
https://www.leavittbrothers.com/masterclass.cfm
Audio Course – the intangibles
https://www.leavittbrothers.com/guidelines.cfm
Email List:
https://www.leavittbrothers.com/email-subscribe.cfm