Good morning. Happy Thursday.
I see stockcharts.com is back online. The site has had problems in the past, but I’ve never seen it go down as it did yesterday. New set ups were added to the trading lists yesterday after the close. Charts will be created today. …
The Asian/Pacific markets closed up (except for China) – there were several 1% winners.
Europe is currently mostly down, but losses are minimal.
Futures here in the States point towards a slight downward bias at the open, but things can obviously change over the next hour before the cash market opens.
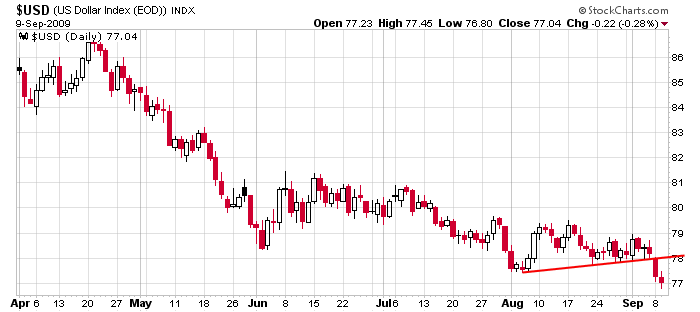
I’ve talked off and on the last month about the importance of the US dollar and how a weak dollar helps the stock market. Here’s the daily chart. After breaking down Tuesday, it followed through yesterday to close at another new low.

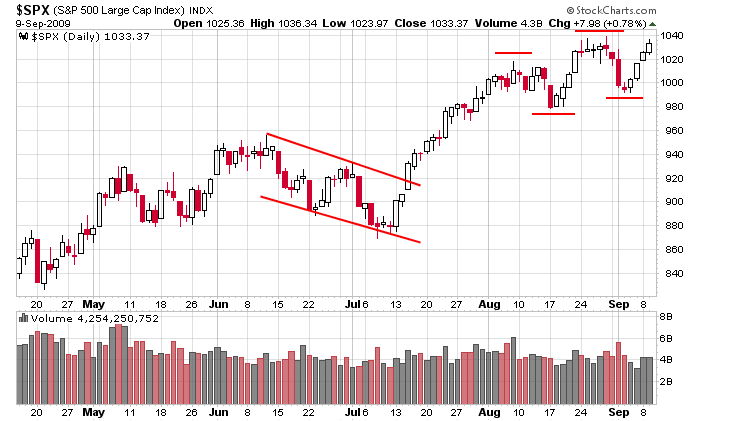
Here’s the SPX daily. Higher highs and higher lows remain the pattern. The index did not make a new high yesterday (the Nas did), but on a closing basis, it was the highest close in almost a year.

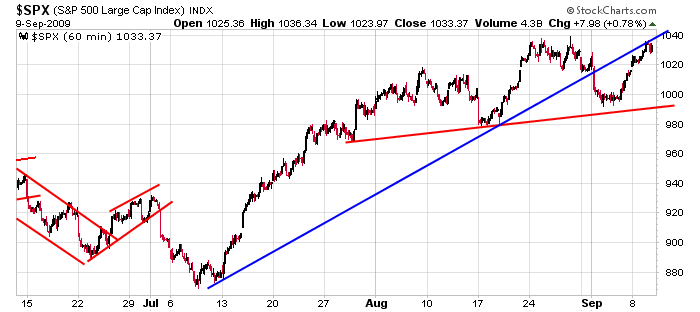
And here’s the 60-min which identifies the current level as a place sellers could step up. Support trendlines often become resistance (even if they’re slanted). Some traders call them psychotic trendlines because they keep coming into play from both directions. I don’t have a special name for them, but I’ve learned much about them while studying median lines.

That’s it for now. I have a little catching up to do now that stockcharts is back.
For those that trade the eminis, today is rollover day.
headlines at Yahoo Finance
stocks to watch from MarketWatch
today’s upgrades/downgrades
yesterday’s Sector Performance
this week’s Earnings Reports
this week’s Economic Numbers
open a real-time futures demo account at…
