Good morning. Happy Tuesday.
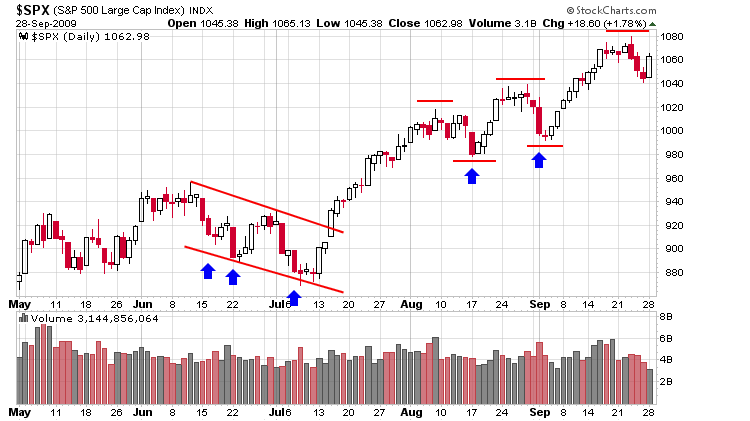
Price-wise, yesterday was a very positive day. The losses from the previous two days were recaptured, but volume was super light (it was a Jewish holiday). How much do we trust the movement? Tough call, so I’m not going to make any assumptions. We also have the end-of-the-month and end-of-the-quarter coming tomorrow. Performance anxiety is a real thing. Fund managers who missed the bulk of the rally will soon be out of work if their performance doesn’t improve. They may be buying the next couple days, so when they send out their statements, they can at least claim to be in certain stocks. …Here’s the daily SPX. Coming into this week I stated the pullback was no different than previous pullbacks – so far this holds.
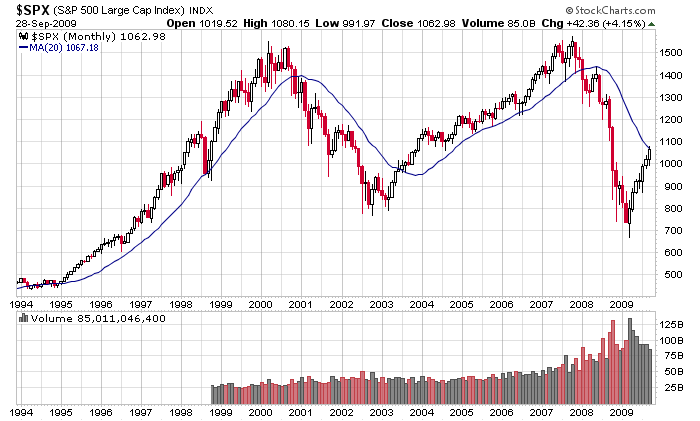
The monthly is also worth keeping an eye on. I’m not one for drawing lines in the sand, but I’m still curious to see if the index can close above its 20-month MA. Note this will be the 7th consecutive up month and the lightest volume month since the market bottomed.
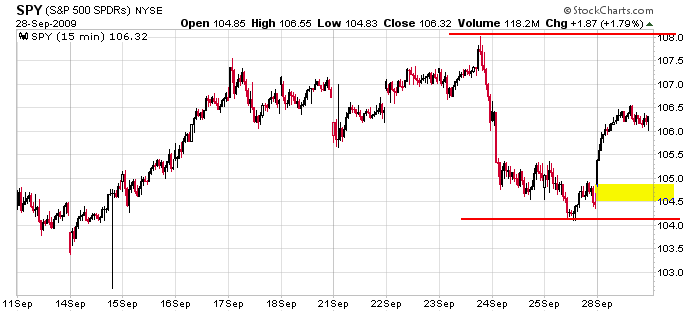
One more. Here’s the 15-min SPY chart. I use it because it shows gaps better than SPX. You can see we’re smack in the middle of the recent high and low with a gap at yesterday’s open.
The overall charts don’t look too bad. The end of the quarter may help prop things up – then we’ll find out what the market is really made up. Be conservative. More after the open.
headlines at Yahoo Finance
today’s upgrades/downgrades
yesterday’s Sector Performance
this week’s Earnings Reports
this week’s Economic Numbers
open a real-time futures demo account at…

0 thoughts on “Before the Open (Sep 29)”
Leave a Reply
You must be logged in to post a comment.
The Q’z have given a strong indication of volatility. I think this is the classic whipsaw. Today’s morning or possibly the entire day’s trading will be the opposite of the direction they’re moving.
On a recent move I noticed the morning session move twice to the down side then take off to the upside. I’ve also seen it where the entire day traded in one direction then they moved the opposite the next or following trading session.
I hope I don’t mess this up! 🙂
You said the volume was light, but looking at the monthly volume I see a significant increase from the dip of 2003 to the dip of 2009. It looks like everybody bought the 2009 dip twice. Where did this extra volume come from? Is there that much more money in the world or is the world trading twice as much with the same amount of money? That looks like a volume bubble.
Relative to the last 6 months, volume has declined, but yes, relative to 2003, it’s huge.
The increased volume is due to all the computers trading back and forth with each other. Simple as that. In fact most of the volume isn’t real. It’s computer algorithms playing chess with one another.
I wasn’t disappointed by the morning volatility. I went long the Q’z.
Today’s dollar is worth a little less than it was in aught three. Heck I recall when I could go to the movies with a dollar and leave with some change. Now you try that these days and you need a gun, I say!
Old metrics aren’t as practical as they once were. This is a function of two variables. One is the trading or positioning of large values at precise levels to the fraction of a penny. Another is the increase of frequency of trades within stocks with beta’s that have essentially not changed.
The beta might be the same yet very large positions are bought and sold requiring small changes to be profitable.
The curve representing trading or what scholars like to call the random walk is being extended by this high frequency trading along that curve. Essentially there’s more fiscal power within what used to be a shorter however similar looking curve.
Markets have expanded to the point where the curve has to be lengthened to accommodate the increase in trading and remain profitable.
That’s my take on it.
The Q’z are rising. They’re trading all over my 42.34 line. I hope the morning session was the downside of this whipsaw.
hey jason
i follow your before the market a lot.just wondering about what you said yesterday that picking bottoms is easy. would you be willing to share as to how you confirm this for yourself as i would like to know many thanks coner
Hi Coner,
When a bottom forms, the negativity is very high. The VIX spikes up…often the put/call spikes…the number of stocks making new 52-week lows spikes…the internal breadth indicators (advancers & decliners and advancing volume & declining volume) heavily favor the bears…news headlines are very bearish. You can feel the fear and frustration in the air.
The opposite does NOT do a good job picking a top. The VIX can stay low for extended periods of time…overbought breadth indicators can stay overbought etc etc.
Picking a bottom is not hard…a top is much more tricky.
Jason
many thanks for taking the time to explain