Options expire this Friday, so let’s take a look at the open-interest on SPY, DIA, QQQQ and IWM to see if they hint at movement the rest of the week (this was written during the day Monday, so it uses data from over the weekend). Here’s the theory: the market conspires to cause the most pain, to cause the most number of people to lose the most amount of money. If the market is to accomplish this, what does it need to do this week?
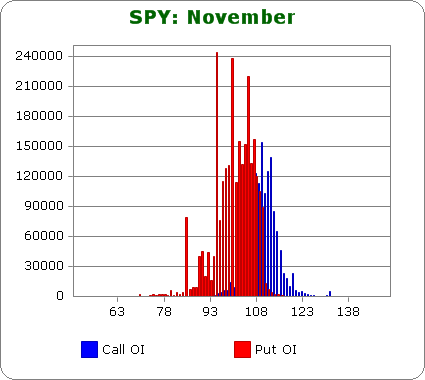
SPY (closed 109.62)

Puts outnumber calls almost 2:1.
Call OI biggest between 107 & 113.
Put OI biggest between 95 & 109.
so there’s a little overlap between 107 & 109, but since Put OI is so much bigger than call OI, a close above 109 would do the most damage…ergo as long as the market doesn’t drop, the put buyers will lose again.
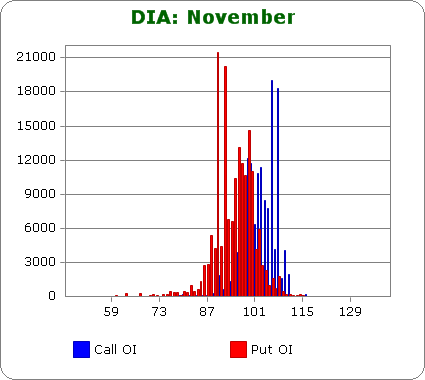
DIA (closed 102.91)

Puts and calls are approx. equal, but call OI is highest several strikes above the current stock price…ergo call buyers are not in line to profit unless the market rallies huge.
Call OI is biggest between 99 & 108, but it’s not steady OI…106 & 108 dominate.
Put OI is biggest between 90 & 100.
So there’s an overlap around 99/100.
DIA can move up a couple points without letting those call buyers make money, so overall, flat to slightly up trading will cause the most pain.
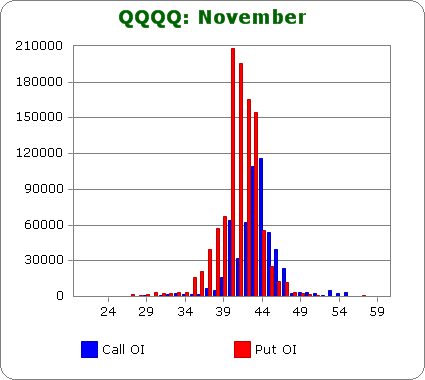
QQQQ (closed 44.01)

Puts outnumber calls approx. 1.6:1.
Call OI is biggest between 40 & 46 with 43 & 44 having the highest readings.
Put OI is biggest between 38 & 44.
There’s some overlap between 40 & 44, and based on Friday’s close (44.01), the market needs to trade flat to cause the most pain.
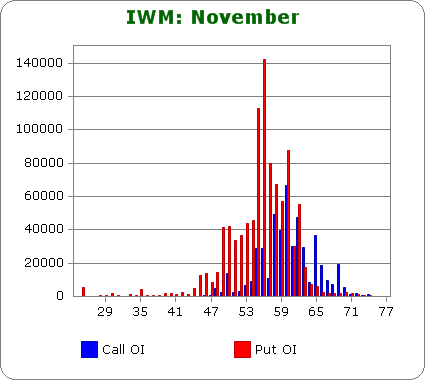
IWM (closed 58.73)

Puts outnumber calls better than 2:1.
Call OI is biggest between 55 & 63.
Put OI is huge between 49 & 63.
If the market wants to cause the most pain, IWM needs to move up to at least the low 60’s which is very doable during a moderate up week.
Overall Conclusion: Once again the bears aggressively bet on the downside, and barring a massive sell-off, they’ll once again be wrong. Flat trading would cause the most pain this week. A small move would enable some call buyers to make money, but such a move would cause just as many losses from the put buyers.
14 thoughts on “Using Put/Call OI to Predict the Rest of the Week”
Leave a Reply
You must be logged in to post a comment.
Jason: These posts of yours seem to give the impression that there is more at play in the market than supply/demand. You don’t mean to imply that somehow the market is rigged, do you? Surely not!!
Sounds like a contrarian theory…
In this case I actually don’t think so. It’s just a fact profits flow up the pyramid, so the market needs to act to not allow all those making the base losers.
I look at your charts and I read your comments and I still have no directional move?
It seems do nothing at the moment is the best move.
Bruce,
Wake up!
There are three sides to a coin. Nobody talks about the rim so we will leave that alone as a coin toss ending up standing on the rim would be a Black Swan event.
The market ending up would be wonderful event for the writers of puts. As most of the writers are professionals the 2:1 ratio on the SPY indicates that professionals when they write the puts hedge themselves by shorting the underlying issue. Prior to expiration they will buy back their short position in hte underlying stock, driving up the market, with the result that the puts expire worthless.
phred
Fred do you have a way to breakdown the numbers…buyers vs. writers?
I have no way to establish a breakdown. At the start of trading the first sale has to be by somebody that writes the put. Theoretically the open interest could stay at one but in practice it does not Beyond that first trade the next buyer could be buying a put from a new writer or from somebody that is selling his long position. The level of open interest (the number of puts outstanding ) indicates in a general way how many puts have been written but I do not know a way to get a breakdown.
Fred
Hi Jason, I always find your monthly analysis on this subject particularly interesting. Could you tell me where I can access OI data? for example I’d be interested to see how Dec looks already. Many thanks, Chris
Here ya go Chris…
http://www.schaeffersresearch.com/streetools/indicators/open_interest_configuration.aspx?ticker=
Op Ex is managed, the hedges live there, and they do in fact “nudge” things, with lots of money.
Nothing new here, but one does need to know why the wings reverse at times, and occasionally come
off.
Whidbey.
Thank you! You often write very interesting articles. You improved my mood.