Good morning. Happy Tuesday.
The Asian/Pacific markets closed mostly up, but gains were small. Europe is currently up across the board. Futures here in the States point towards a moderate gap up open for the cash market.
The US dollar is down, and gold, silver and oil are up.
The long term trends are still up (but we don’t trade off the long term trends – we just keep them in the back of our minds). The shorter term trends are down.
If left alone, I’d expect weakness to continue, but as we know, the market hasn’t been left alone. The Fed is dumping money into the system, and that money is finding its way into the market – whether we like it or not. My near term bias remains to the downside, but I’m not exactly going all in because of the Fed wildcard.
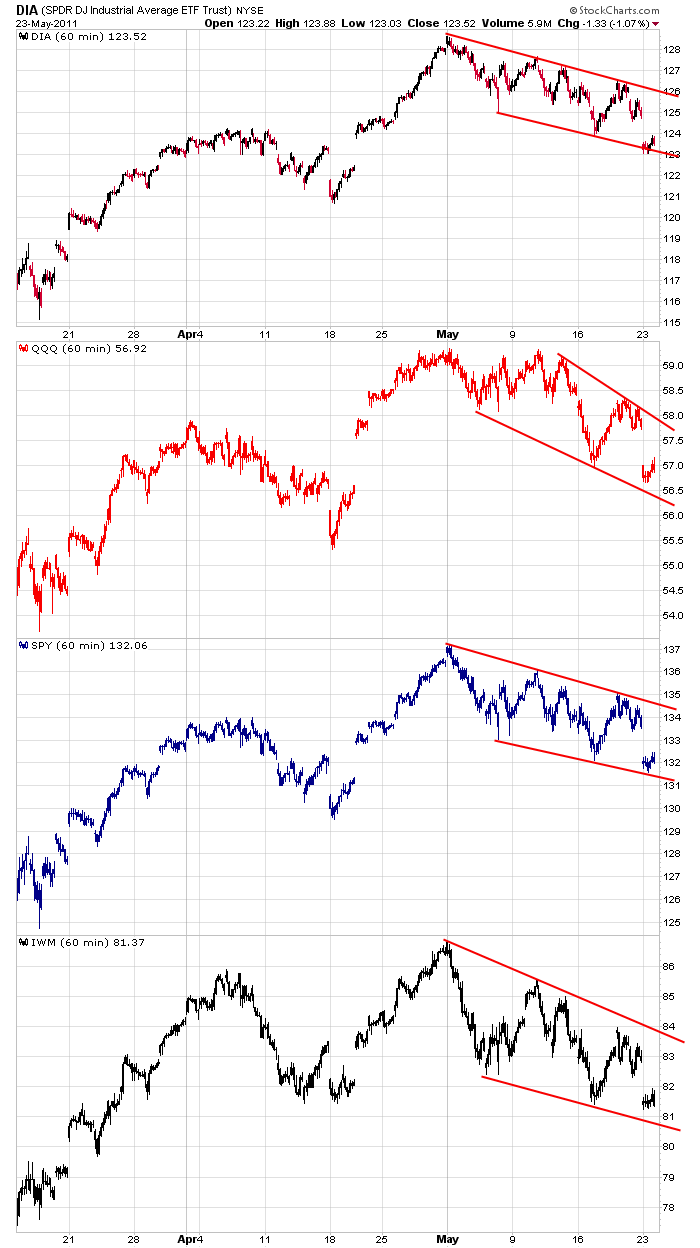
Here are the 60-min index ETF charts. They’re all in falling wedges or channels. If I backed the charts up a few more months, the overall uptrends would be more obvious. Until these patterns resolve up, or until we get a total washout to the downside, my negative bias will remain.

Keep your eye on the dollar. The market and it have been inversely correlated for a long time, so it the dollar continues to move up, the path of least resistance for the market is down. More after the open.
headlines at Yahoo Finance
today’s upgrades/downgrades
yesterday’s sector performance
this week’s Earnings
this week’s Economic Numbers
0 thoughts on “Before the Open (May 24)”
Leave a Reply
You must be logged in to post a comment.
Lotsa POMO being thrown at the markets over the next few weeks. Last six day batch started last Friday and finishes up Thursday, around $35B or so. Doesn’t always have an upward effect but things are pretty sold out here. See if the 100 day moving average (either sma or ema) holds.
Well, I hope this comes as no surprise to anybody but the Fed is
looking at the same exact charts that we all are. So what happens
is when we start approaching the lower end of that channel, the
Fed will try to induce a short cover rally so that we can bounce
off of that low. If you look at the IWM chart it’s even more
obvious. Have a good day everybody. HW
if greece defaults,all banks automaticly go insolvent
the fed may have to sell ibm in order to bail out europe
Does anybody have a way of identifying heavy option activity in both puts and calls?
If so, please send Jason an email to get in touch with me. My trading account is
with Fidelity. Thank you, HW
You need history? OptionVue or IVolatility.com
Gheez…you’re a swell guy, RichE
How can I ever repay you? HW
Share.
Buy a PUT.
What else do you do with your tongue?
try $CPU OR $CPCI or $CPCE
codes are diferent on some systems
on esignal $pc-st for retailers
$pcci-st–instos chart
TLT? Is money moving to safe harbors?
Tues: 2pm Just bought some call options in Oshkosh OSK. Got a new buy rec
from Standard & Poors plus Najarian optionmonster has a buy on it as well.
should i go long or short tomatoes
It’s a cryptic message from the zen master to buy TOM.
it could be a alfa TOM—no position in matter,energy,space or time
but if its listed on the spx its a doji