Good morning. Happy Monday. Hope you had a nice weekend.
The Asian/Pacific markets closed mostly down. Hong Kong, Japan and Singapore lost more than 1%. Europe is currently down across the board. There are no 1% losers there. Futures here in the States point toward a negative open for the cash market.
This of course comes off a very bad week where all the indexes posted significant losses and closed at their lows. The falling patterns posted a week ago have either been invalidated or are in the process. Things do not look good right now. Best case scenario seems to be sideways movement but the path of least resistance is down. If the market wants to move up, it’ll need to move up, then pull back a little and chop around, and then move up again. This will take time. For now, we need to keep selling rallies.
Right now my downside target for the S&P is 1200 per the 20-month MA on the monthly chart shown below.
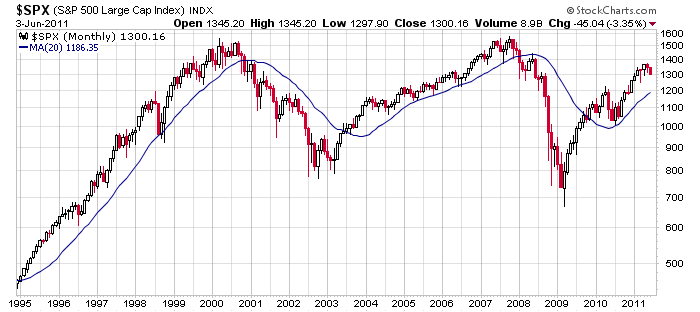
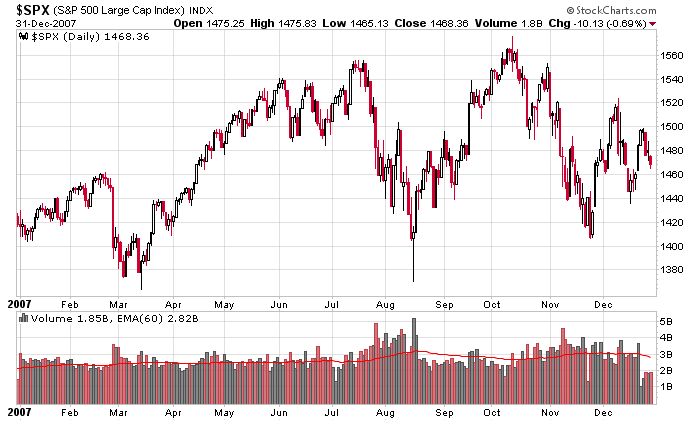
But before every gets all giddy about a top forming, let’s remind ourselves what the 2007 top looked like. Here it is…huge moves in both directions that lasted an entire year. Remember, tops take time to form. More after the open.
headlines at Yahoo Finance
today’s upgrades/downgrades
yesterday’s sector performance
this week’s Earnings
this week’s Economic Numbers
0 thoughts on “Before the Open (Jun 6)”
Leave a Reply
You must be logged in to post a comment.
Jason must have had some dreams about the stock market crashing, or something
to that effect. Over the weekend I went through a consortium of websites
that I follow, and the concensus for the downside target is 1250 to 1275.
I don’t think we are going to get there in one fell swoop, however. HW
Jason – thanks for that great monthly chart! And, if we’re seeing a replay of the 2007 top, the 1250 area should be long term resistance if/when the 20 month MA is taken out, in my opinion. In the mean time, it appears we see a trading range into the fall period with any extended downside holding off until perhaps 2012.
1250. That was a great year for Scotch, wasn’t it? HW
what would ur trading range be ,Pete
PeteM
can u also give us a world wide trading range as its all one market
Assuming the Jason’s 20-month MA is ;ong term support, I would estimate that 1200-1300 SPX would be the trading range for the remainder of 2011 with a lot of volatility.
Thanks Pete,i like a lot of volatility
for me its more fun and less stressfull being a daytrader and in /out–sleep when i want wit h a flat possition,knowing i have scalped uncle ben a few times in the day
i can wait till 2012 for spx666
These are the parameters I am currently using for swing trading:
IWM 15 min chart (using the Stockcharts.com website)
15 min Predefined range 0-0-7 (days)
Line (solid dashed) 1280
Simple Moving Avg 10
Simple Moving Avg 15
Simple Moving Ave 30
Simple Moving Avg 40
RSI 14
MACD 12,26,9
Average trade should last 2 to 3 days
depending upon market conditions. HW
Neal , last week u mentioned a big trading range
can u tell us what areas u see
Aussie JS, if I may answer your question. The market has experienced
great difficulties in the recent past and has managed to overcome
them without too much of a problem. Until contagion sets in and
everybody starts selling en masse, the markets remain relatively
intact, at least for now. 2) According to strict Elliott Wave
theory there must be one more new high (or at least a truncated
wave topping process) before the markets move down again.
Therefore we should make another run into the 1350 area soon.
Howard – I’d agree with you if Ben can get his Boyz on Wall Street to support the market in the 1270-1295 area to keep the “triangle” pattern alive. If things get away from Ben & the Boyz, then 1250 needs to hold or the probabilities shift to the May high being “the” top of the 2yr + rally off the MAR’09 low.
I spoke with Chuck this morning and he said Ben is aware of the charts I mentioned last week. I get the feeling he may not want to use a lot of ammunition defending 1270-1295 and may be looking at 1250. He’s also watching XLF (the Financial ETF). He may be more worried about defending XLF in the 12.50-13.50 area. It wouldn’t be good to have the financials breaking down. Chuck said that Ben is sounding more desperate. He really needs to buy time. I told Chuck that Ben had better get a new high in place by year end or sooner.
If we wake up one morning and chicken little is falling from the sky,
you can bet your last dollar the Boyz will try to stay within the
1270 to 1295 range. Funny thing how we happened to close on Friday
at 1300 and change at the bell. Hmm…?
today terrible tim g just brought the markets undone
he is obviously working against the fed
he said he wants to control and regulate the derivitives markets
london the biggest exchange in the world started selling of
–also a three thrust pattern down that are currently in this channel can give away to a crash
but uncle ben will save us as long as we buy hope prey –em
–im just trying to see where others see the ranges of this sideways channel
i love sideways channels –so easy to trade–and such a simple trading plan
Nothing in the stock market is that ‘easy’ Aussie JS,
or else we’d be millionaires by now. I think you are
taking the same prescription medication that Neal is on.
many make it more complicated than it is
trading is 90% mind set and 10% know how
I suspect that the Fed is saving all of their
bug juice for tomorrow’s ‘turn around Tuesday’
indeed !