Good morning. Happy Wednesday.
The Asian/Pacific markets are mostly up – Australia, Japan, South Korea and Taiwan are posting nice gains. Europe is currently up across the board – most of the indexes are posting 1% gains or better. Futures here in the States point towards a moderate gap up open for the cash market.
AAPL did great with earnings. The stock is up better than 5% before the open to trade near 400. Amazing considering the stock was in the low 300’s just a month ago. Large cap stocks (it’s the largest cap stock) don’t typically move 30% in a month. Amazing.
The dollar is down. Gold and silver are down. Oil is up and getting close to 100 again.
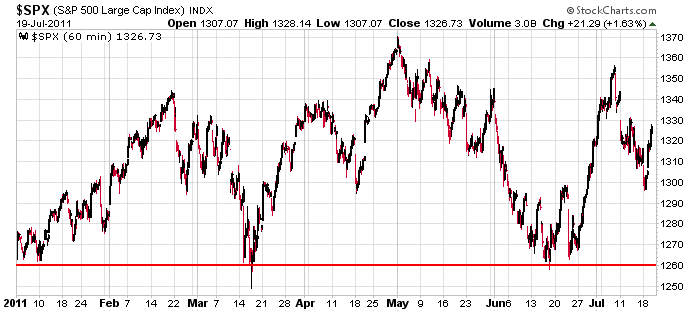
Here’s the 60-min S&P chart since the beginning of this year. We’ve gotten some nice tradable swings in both directions, but entering with the thought you could hold and ride a trend has led to frustration. Dips have been bought; rallies sold. If you’re bullish, you’ve gone back and forth between being happy and pissed off. If you’re bearish, you’ve gone back and forth between being excited and hopeful and frustrated. From a trading standpoint, there’s nothing wrong with the movement. The market goes up and down; our job is to ride it in both directions or at the very least know when to head to the sidelines when appropriate.

The market has been in consolidation mode since the beginning of the year. The market is likely to jump when the debt ceiling situation gets resolved, and then who knows. The market may continue to trade range bound for another 6-7 weeks until the fall season begins. Fine with me. More after the open.
headlines at Yahoo Finance
today’s upgrades/downgrades
yesterday’s sector performance
this week’s Earnings
this week’s Economic Numbers
0 thoughts on “Before the Open (Jul 20)”
Leave a Reply
You must be logged in to post a comment.
Candlesticks: “A picture is worth a thousand words” I’m interested in the words, math words. How would you express a Candlestick mathematically?
trading is 90% mindset,only experiance will teach u that and Jason has a way of puting things so simplely and realisticly that it declogs any bias the old mind has set up—well done
yes we are in a sideways topping distribution/accumulation–these are often violent,volitile swings in either direction
whilst chart watching for h/s-broadening jaws of death,ew,gann,or any pattern is nice
it really come down to the instos will move it anyway they want to make a profit and they use news events as a smoke screen to do this
the reality is that for the last 6 weeks or longer there have been to many bears
instos and retailers cant be on the same side–so we get a short cover rally and the instos take on the retailers call bets as market makers–interesting to see how many times
price sticks on round number stike prices as instos get set
—-fundamentally we have 2 events
the double cross ambush at the ok corral—-the debt ceiling wont be raised by 2nd/8
its politically been set up that way
–merkel of germany wont put any momey in and bond holders will take a large haircut–thats the banks—so liqidity is coming out
oh well nothing better to do on a sleeppy day like todaythan write posts
–my tick indicator has be on the nutral zero line all day–saying consolitation
oops its just livening up to the down side –cya
What time Eastern did you get this signal?
it would have been about 2.45pm ny time and again now at 3.30 as my nyse tick hit minus 1000 line,but its not being confirmed by euro–so inlight of the nature of the day
unless its a quick 10 min scalp–i havent taken it
thanks, I’m trying to calibrate the $tick to get rid of the noise. Not having much luck. How do you get rid of the noise?
whilst mine is a propretor indicator from my previous emini teacher
but i simply have a line drawn at the minus and plus 1000 and one at the zero line
now depending on colour of your ind and chart –i have one colour for upper and lower third and a nutral colour for middle near zero line
–im looking for divergences in price to tick and nature of intraday tick to ind insto character–it took me a while to get uset to its idiosincesys
—should have taken my orriginal scalp as ind was right at the dji high of tue piviot
now down to tues close piviot
one of my training exersises used to be to bring up a old chart –cover up price and with the tick only plot price as u think it would be
Thanks
oh–u can have piviots –inc previouse days high low and close –plus s/r plus ma’s ect but no price if u are going to do the training exersize
–nope –to much sideways chop
im watching spx at 1334–euro peaking at 1.42 ish for a resumption to the downside
or if resistance can be broken–well im waiting to see
only playing with short term scalping money at 100 to 1 leverage