Good morning. Happy Friday.
The Asian/Pacific markets closed mostly down. Hong Kong, Japan and South Korea dropped more than 1%. Europe is currently (before the employment data) mostly up, but there are no 1% winners. Futures here in the States point towards a positive open for the cash market.
The employment numbers are out. Here they are:
unemployment rate: 8.5% (from 8.6%)
nonfarm payrolls: up 200K
private payrolls: up 212K
average workweek: up slightly to 34.4 hours
hourly earnings: up 0.2% to 23.24
The futures market reaction was very muted.
I continue to think the market is in decent shape. Not great shape, just decent shape. My bias leans to the upside. Several key groups are doing well. Many leading stocks are breaking out. Overall, there are many more good looking patterns than bad. If you didn’t have access to the index charts and instead had to judge the market based on individual stocks that comprise the indexes, you’d come to the same conclusion – that the market leans to the upside.
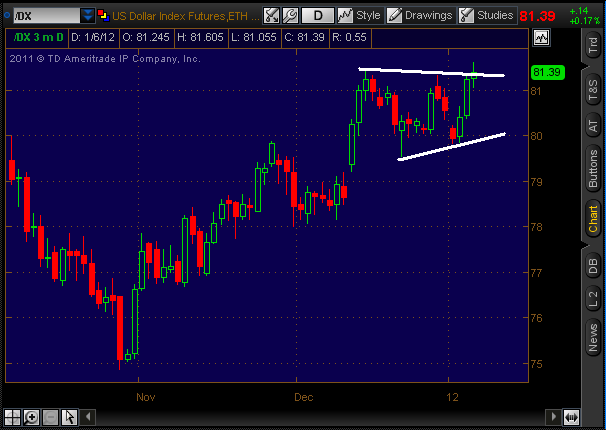
A concern I have right now is the dollar. Here’s an updated chart included this morning’s movement. It’ll be much harder for the market to rally if the dollar moves up.

headlines at Yahoo Finance
headlines at MarketWatch
today’s upgrades/downgrades
this week’s Earnings
this week’s Economic Numbers
0 thoughts on “Before the Open (Jan 6)”
Leave a Reply
You must be logged in to post a comment.
QE3 in March will probably bring USD down, no matter what SocGen says. But yes, March is long ways from now, so the trend remains till it changes.
Brian – nice to see you and others sharing points of view so perhaps we can learn something from each other.
I noticed your comment yesterday at 1:16 PM, “I think that is 1 of 5 of C of 2. Still more upside to complete C and consequently 2”. Please tell me which time frame you are referring to and from where wave 1 (of 5 of C of 2) begins. Also, what’s your EW analysis of the bigger term picture going back to Last May’s high. I’d like to compare it to my EW interetation, recognizing that you’re probably working from the futures whole I use SPX (Cash) market. Thanks.
I do focus on the futures and include trading outside of normal trading hours w/12 min bars. My count for wave 1 (of 5 of C of 2) began on 1/5 at 9 am CST. But, I should have stated it as wave 1 (of 5 of 5 of C of Y of 2). Sometimes I get disoriented in the depth. Anyway, I can not yet rule out that the thrust to 1282.25 (ESH12) this morning (7:30 CST) completes the move. I want to count it as top of 3, but, the following correction is sharp.
And, with regard to last May’s High, I currently don’t expect it to be exceeded for years. Since that high, I believe the market has been working to expel all those without conviction, both long and short.
Brian – thanks! You’re working in a much smaller time frame than I usually do. I thought you may have been counting from the DEC low in a larger time frame. Anyway, regarding the MAY high, I think the current rally from the OCT low has a low probability of testing the MAY high but I do think SPX 1300-1320 can be achieved on this rally from 1202. But, time will run out if it’s not done by late Jan/early Feb, IMO.
I agree with your opinions. Of course, only time will tell. Everything appears so clear in the rear view mirror. 😉
Do you know if there is a way to to get alerts when stuff is posted on this blog rather than having to reload this page?
I figured out how to subscribe to the feed.
Yesterday, I mentioned a trendline on the SPX hourly chart connecting the LOWS starting from DEC 21st. Since that low there are now 4 times that this trendline has been tested, including today. With each test, I think the trendline has more and more short term significance.
I also note that, from an EW perspective, I continue to see 3 wave movements including the pullback from late yesterday’s high (around SPX 1283ish to today’s low). Given that hourly chart upward trendline support, SPX seems to want to work its way up to 1292 and perhaps beyond. Until that trendline is broken & SPX begins trading below it, I’m now looking for support areas to get long.
By the way, also note that if you draw a channel on the SPX hourly chart connecting the 2 highs since DEC 21st (with the lower trendline conncting the lows going back to DEC 21st) the midpoint of the channel has been resistance since WED on rallies.
one index can inflence the others
the indexes are being held up solely by the ndx 100
which has reached the outer limits wave e of triangle from oct low
the ftse and dax are also complete
but instos dont like to crash markets till 2nd week earnings—maybe
but with crashing euro they may have no choice
does the spx have the good oil —nah —lower double top from oct high is over