Good morning. Happy Monday. Hope you had a nice weekend.
The Asian/Pacific markets closed mostly down. India dropped more than 2%; Singapore and South Korea dropped more than 1%. Europe is currently down across the board. France, Germany and Switzerland are down more than 1%. Futures here in the States point towards a moderate gap down for the cash market.
The dollar is up. Oil and copper are down. Gold and silver are down.
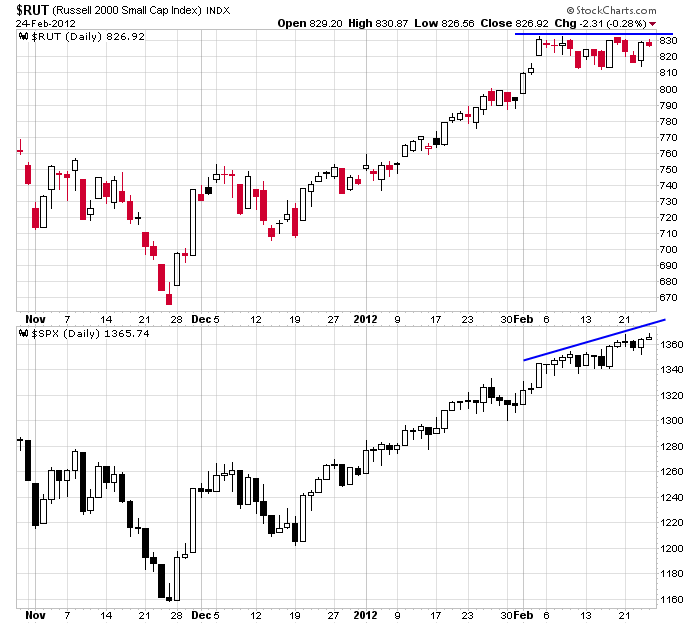
I don’t have anything to add to the comments I made over the weekend in the Weekly Report. The trend is up, but there are lots of warning signs. Several indicators are at an extreme level; several breadth indicators are diverging from the price action; some important groups such as the banks and semis did not match the market’s high high last Friday; and the small caps are lagging. As an example, here’s the S&P vs. the Russell.

Play good defense. Within an uptrend I go back and forth between being aggressive and lightening. Right now is a time to lighten up and play it safe. More after the open.
headlines at Yahoo Finance
headlines at MarketWatch
today’s upgrades/downgrades
this week’s Earnings
this week’s Economic Numbers
0 thoughts on “Before the Open (Feb 27)”
Leave a Reply
You must be logged in to post a comment.
The fed has allowed the markets to drop a couple percent into the end of the month to give 1st of the month contributers a non WS screwing entry the last two months. I think we get a 1st of the month bounce off the 20dema until we don’t
From an EW perspective, it will be interesting to see the wave structure of this decline as it approaches the 20day EMA (SPX 1346ish). IMO, we have completed at least wave 3 of C. My wave C target of 1375 +/- 5 has essentially been tested, so an impulsive move 5 wave move down that breaks through the 20 day EMA could be an early sign that wave C may have ended. But, I wouldn’t seriously entertain that thought unless 1292 was taken out. Above that level, the current 50 day EMA (1313ish) coincides with the OCT/DEC trendline support.
EW notwithstanding, I note that RUT:SPX & RUT:INDU has been declining throughout FEB. The momentum of Accumulation/Distribution uptrend is in decline. IMO, all of this is an indication that we are close to the end of this rally since OCT (or at least since DEC). If SPX moves to a new high after this correction, it should be classic wave 5 behavior, i.e. negative technical divergences, stock distribution from strong to weak hands, etc. Cyclically, it may be time to beware the Ides of March as far as the long side is concerned.
What is a, “Negative Technical Divergence”? Wouldn’t they just converge, diverge or confirm?
they will let the market come down more and test reality when greece gets their $
traders are like evolution. Those that are first and best to adapt may survive. the bernak has already told us he will add and remove liquidity without saying anything first. a trader can only observe how the market is behaving, as we have established things that used to matter like TA, don’t now. this market is being controlled
Consider but dont get lost in following the indices. Look under the hood.
Lots of strong groups, mostly defensive now, and lots of alphas stocks besides AAPL.