Options expire this Friday, so let’s take a look at the open-interest on SPY, DIA, QQQ and IWM to see if they hint at movement the rest of the week. Here’s the theory: the market conspires to cause the most pain, to cause the most number of people to lose the most amount of money. If the market is to accomplish this, what does it need to do this week?
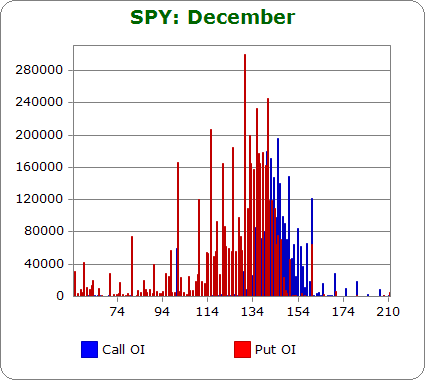
SPY (closed 142.47)

Puts out-number calls 2.1-to-1.0 – the same as last month.
Call OI is highest at 137, between 140 and 150 and at 160.
Put OI is highest at 110, 115, 120, 125, and then it’s steady between 129 & 143.
Not only is the overlap zone relatively small (140-143), the put open-interest zone pretty much comes to an abrupt stop right at 143. If puts and calls were equal, I’d say a close in the middle of the range would cause the most pain, but they aren’t equal. Puts dominate, so a close near the top of the range is preferable. Today’s close was at 142.47 – near the top side of the range. Flat trading the rest of the week is needed. .
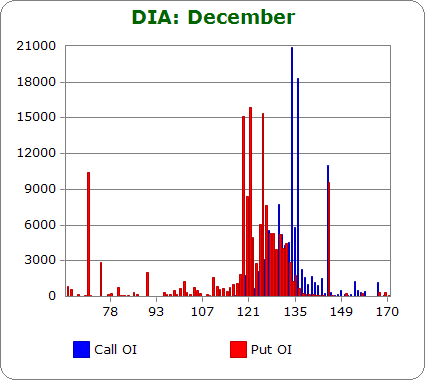
DIA (closed 131.74)

Puts out-number calls 1.0-to-1.0 – less bearish than last month.
Call OI is highest at 134 and 136.
Put OI is highest between 119 and 121 and then again at 125-126.
Open-interest on DIA doesn’t matter because the volume is so tiny (volume on SPY is 10x greater), and the high OI strikes are far apart. There’s nothing to read here, so I’m not going to say what needs to happen the rest of the week because it doesn’t matter.
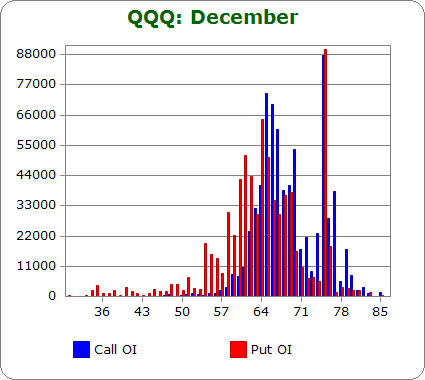
QQQ (closed 65.12)

Puts out-number calls 0.9-to-1.0 – less bearish than last month and the first time in years call open interest is greater than put open interest.
Call OI is highest between 63 and 70, and there’s a big spike at 75.
Put OI is highest between 60 and 69, and there’s a big spike at 75.
I’ve written dozens of these reports over the years, and I can’t remember the put/call numbers like this. For starters, calls out-number puts – that’s a first in a long time. Second, most of the time there are two distant zones with a little overlap in the middle. Not this time. Call and put OI match up very well, and the spikes at 75 are nearly identical. It seems like wherever QQQ closes on Friday, half the option traders will be happy, and the other half pissed off. Today’s close was at 65.12, which is at the lowest of the three biggest call strikes clumped together in the middle of the chart. If the stock closes right here, most of the call buyers will lose, and I’d estimate half of the put buyers will do the same. I’m not sure what to make of the spike at 75 – a level that QQQ has not traded at since the dot come bubble burst. If the market wanted to cause the most pain, flat trading or possibly a slight move up is needed.
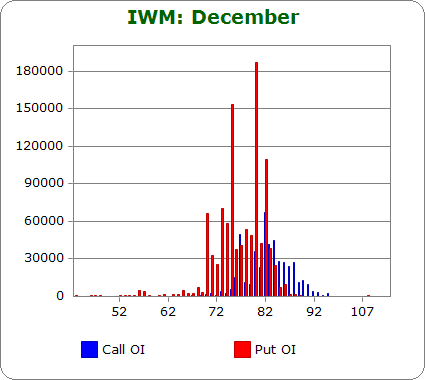
IWM (closed 82.54)

Puts out-number calls 2.5-to-1.0 – more bearish than last month.
Call OI is highest at 77, 80 and between 82 and 84.
Put OI is highest at 70 and between 72 and 82 with those big spikes falling at 75, 80 and 82.
Puts dominate calls to such a degree that focusing on them rather than some happy middle of the road is best in determining where the market needs to close. Today’s close was at 82.54. That’s above the entire high-OI zone and above all three big spikes. It also happens to be where the single biggest call OI spike occurs. Hence a close here would cause the most pain, so flat trading is needed.
Overall Conclusion: Option buyers again have bet on downside moves, and if the market conspires to cause the most pain, to cause the most number of option contracts to expire worthless, flat trading is needed the rest of the week.
0 thoughts on “Using Put/Call Open-Interest to Predict the Rest of the Week”
Leave a Reply
You must be logged in to post a comment.
Recently I seem to see oi and didn’t know what it meant
All of a sudden I read this post and fully understand
Thanks
Liz
I appreciate your work, in particular these “using P/C for OpEx” posts… however, isn’t OpEx NEXT week?
Yes Mike, I totally screwed up. It’s next week.
Jason