Options expire this Friday, so let’s take a look at the open-interest on SPY, DIA, QQQ and IWM to see if they hint at movement the rest of the week. Here’s the theory: the market conspires to cause the most pain, to cause the most number of people to lose the most amount of money. If the market is to accomplish this, what does it need to do this week?
SPY (closed 164.44)

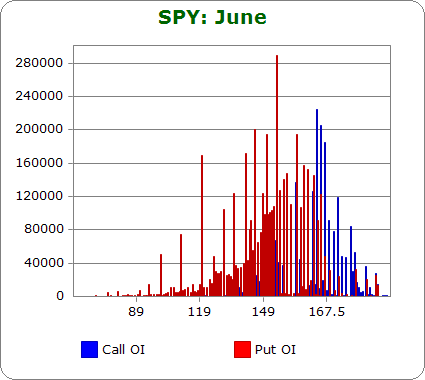
Puts out-number calls 2.2-to-1.0 – the same as last month.
Call OI is highest at 160 and between 162 and 168.
Put OI is highest at 120, 130, 135, 140, 145 and between 148 and 166.
There’s a little overlap in the low 160’s, but the highest call strikes in the mid 160’s only overlap by one strike. The dividing line seems to be 166 – a close there would expire all the highest put open-interest strikes and most of the call OI strikes worthless. Today’s close was at 164.44, a good level but slightly below ideal. Flat trading the rest of the week would cause a lot of pain; a small move up would cause even more.
DIA (closed 151.78)

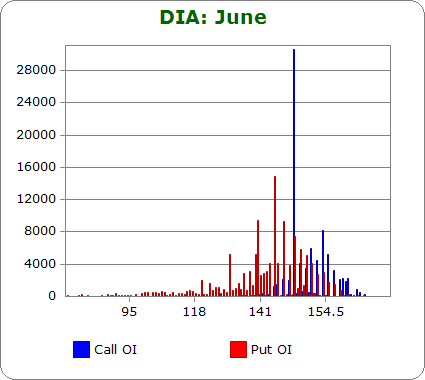
Puts out-number calls 1.3-to-1.0 – about the same as last month.
The big call spike is at 149, and then the following strikes also have decent volume: 152 – 155.
Put OI is highest at 145, and then it tapers down to 139 and up to 151.
All the big (relatively speaking) put spikes are below the big 149 call spike, so let’s say a close at 149 is ideal. Today’s close was at 151.78, above the ideal. As of now, some of those 149 call buyers will make money. A move down is needed to close those options worthless.
QQQ (closed 72.98)

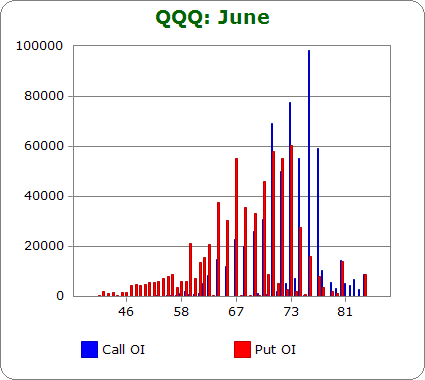
Calls out-number puts 1.1-to-1.0 – about the same as last month.
Call OI is highest between 71 and 76.
Put OI is highest between 67 and 73.
There’s definite overlap between 71 and 73, so a close in the range would cause the most pain. Today’s close was at 72.98, at the top of the range. No movement the rest of the week would cause lots of pain, but a small move down would cause more.
IWM (closed 98.35)

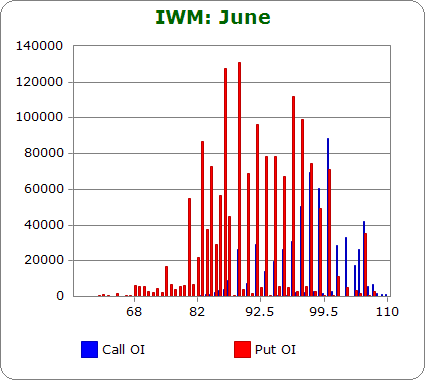
Puts out-number calls 3.0-to-1.0 – slightly less bearish as last month.
Call OI is highest between 97 – 100 with 100 being the big spike.
Put OI is a solid block between 83 and 100.
The top side of the put OI overlaps with the highest call OI strikes, so a close in the 98-99 area is needed to cause max pain. Today’s close was at 98.35, exactly where it needs to be. No movement is needed the rest of the week.
Overall Conclusion: The movement needed the rest of the week to cause the most pain differs between these ETFs. SPY needs a small move down; QQQ needs a small move up; IWM doesn’t need any movement. SPY and IWM are most important because they have the most volume. The net of these is flat or slightly up movement the rest of the week will cause the most pain, so basically the market can continue to chop around in a range as long as it doesn’t drop much the rest of the week.
0 thoughts on “Using Put/Call Open-Interest to Predict the Rest of the Week”
Leave a Reply
You must be logged in to post a comment.
Jason,dont know what your feeling are on this
we know the big insto market makers take the orders,or opposite side for these opts,like true horse book makers they lay of some of the bets,but the game is for the market maker to make money
there used to be charts that would show the holdings of the insto bookmakers and the retailer players–,but since no true retailers i stoped following them
question is do you know of any charts that would show the holdings of the insto big boy bank market makers and which way they would like to push it,as they have the capacity to move the market–ie are the instos holding more puts or more calls
and would such a chart be usefull here as a add on ,as well
Aussie…I don’t have access to anything that isn’t easily available for free on the internet.
http://seekingalpha.com/article/1507472-speculators-fight-the-fed-once-again-in-the-bond-market-can-they-finally-win-one
THIS POST ON SEEKING ALPHA MIGHT DEAL WITH YOUR INTERESTS. W….
I am holding puts, and pointing at 1653-58 as a likely swing point that will start a correction. Just following volume and fib levels it appears that this could be a significant correction to about the 200 SMA on the major indices. Gold has me interested at 1328 as a buy for 5-10% of portfolio.
Jason, I appreciate your review of this event. Thank you.