Like the previous two weeks, last week started weak and ended strong, producing long lower tails on the weekly candles. Not for the faint of heart. The market has been noncommittal for several months. Rallies have gotten sold, dips have gotten bought. No move has lasted long. What has taken place on a macro scale the last six months has taken place intraweek the last three weeks. In each case a move down spooked the bulls and got the bears a little excited. Then a move up acted as a reminder the overall trend is up, and until the relentlessness of the buyers disappears, our bias should remain to the upside. The market is doing its best to shake traders out in both directions so many fewer participate in the next trending move.
The market is in a range – pure and simple. We can want it do something or hope it does something, but none of that will change anything. One of the hallmarks of successful traders is the ability to make small changes based on market conditions. Context is king. The same pattern in two different markets will yield two different results. New traders learn this the hard way. They take a trade and make money. A month later they take a similar trade and lose. Frustration follows, but it shouldn’t. There was nothing wrong with the losing trade. The problem was with the trade management, which needed to change given the different market environment.
No matter what you trade, how long you hold, what techniques you use, subtle changes need to be made. Recognition of the hand you’re dealt is key. Ignoring this will likely lead to chopping one’s account. Nobody can establish an exact trading style with and expect to stick with it forever. Even large funds staffed by computer science Ph.D’s that mostly trade on autopilot with computer algorithms have to tweak those algorithms on a pretty regular basis.
The market is in an interesting spot here. It could breakout and rally…or breakout and get faded…or not breakout at all. Yeah I know, I sound like the weather man (it might rain, it might not rain). Nobody knows what’s going to happen, so we have to consider the most likely possibilities and plan for each. What will you do if the market rallies right out of the gate Monday morning? What will you do if the market rallies and then gets faded a day or two later? Answering these questions is trading. Any moron can buy a stock. Having a plan as to what you’ll do with it given different scenarios is where the proverbial rubber meets the road.
Let’s get to the charts and see what they say. The small caps have been lagging, and the internals have been weak. Has anything changed? Let’s see.
Indexes
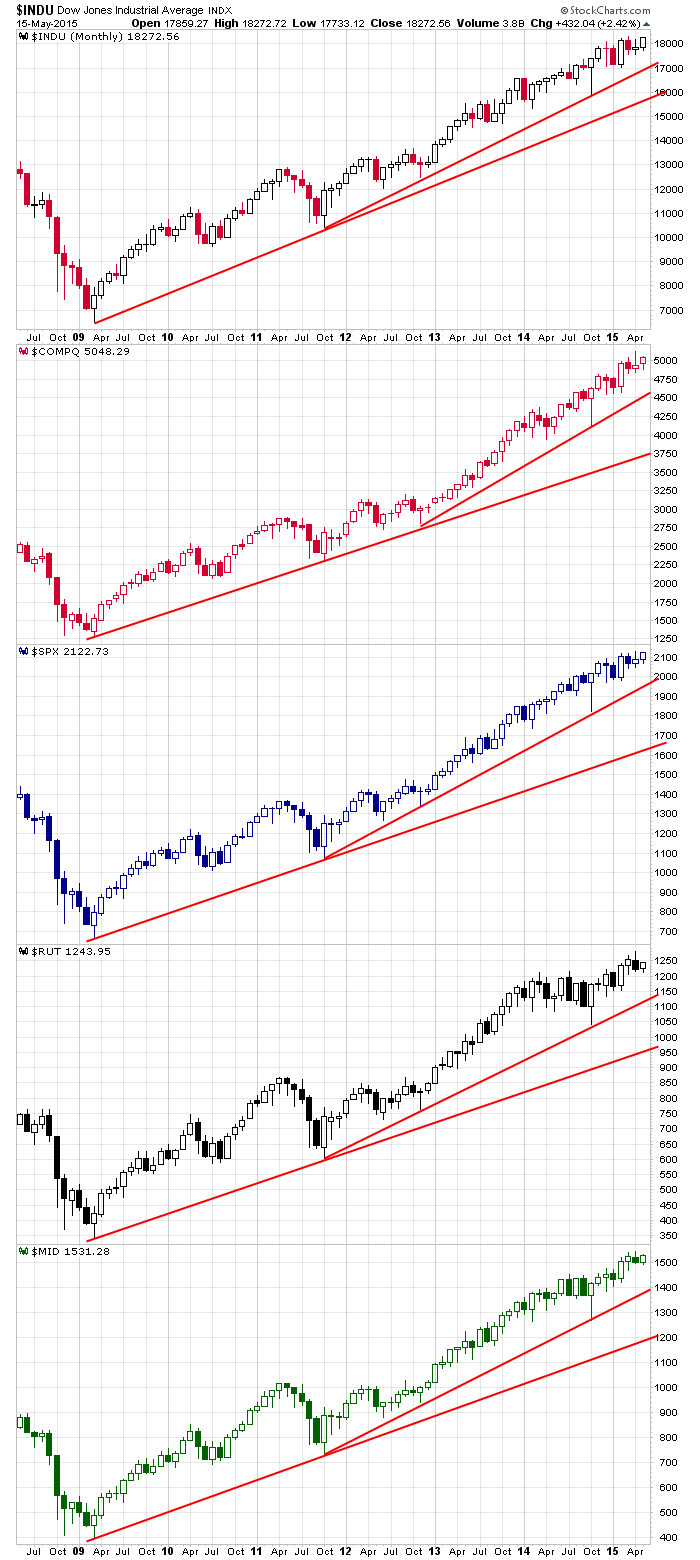
The Monthlies: Just a quick reminder. The long term trend is up and super strong, and a 5% correction wouldn’t change anything.
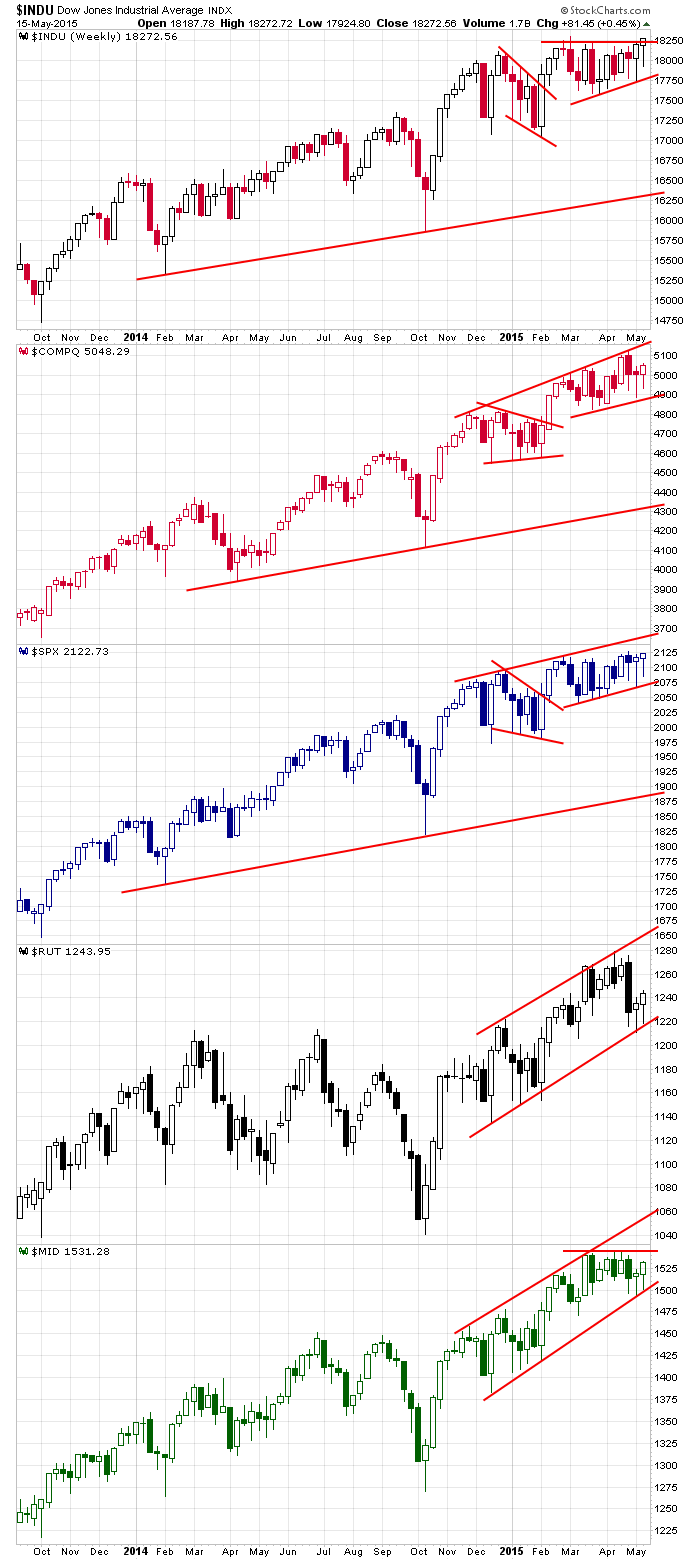
The Weeklies: Look at those long tails on the weekly candles the last three weeks. Three times the indexes sold off, and three times they’ve rallied back and recaptured the losses. The bears could throw in the towel, realizing their efforts have been fruitless. The bulls could get tired of rescuing the market each week and throw in the towel on the next mini sell-off. It’s a battle no one is winning – except the brokers who continue to collect commissions.
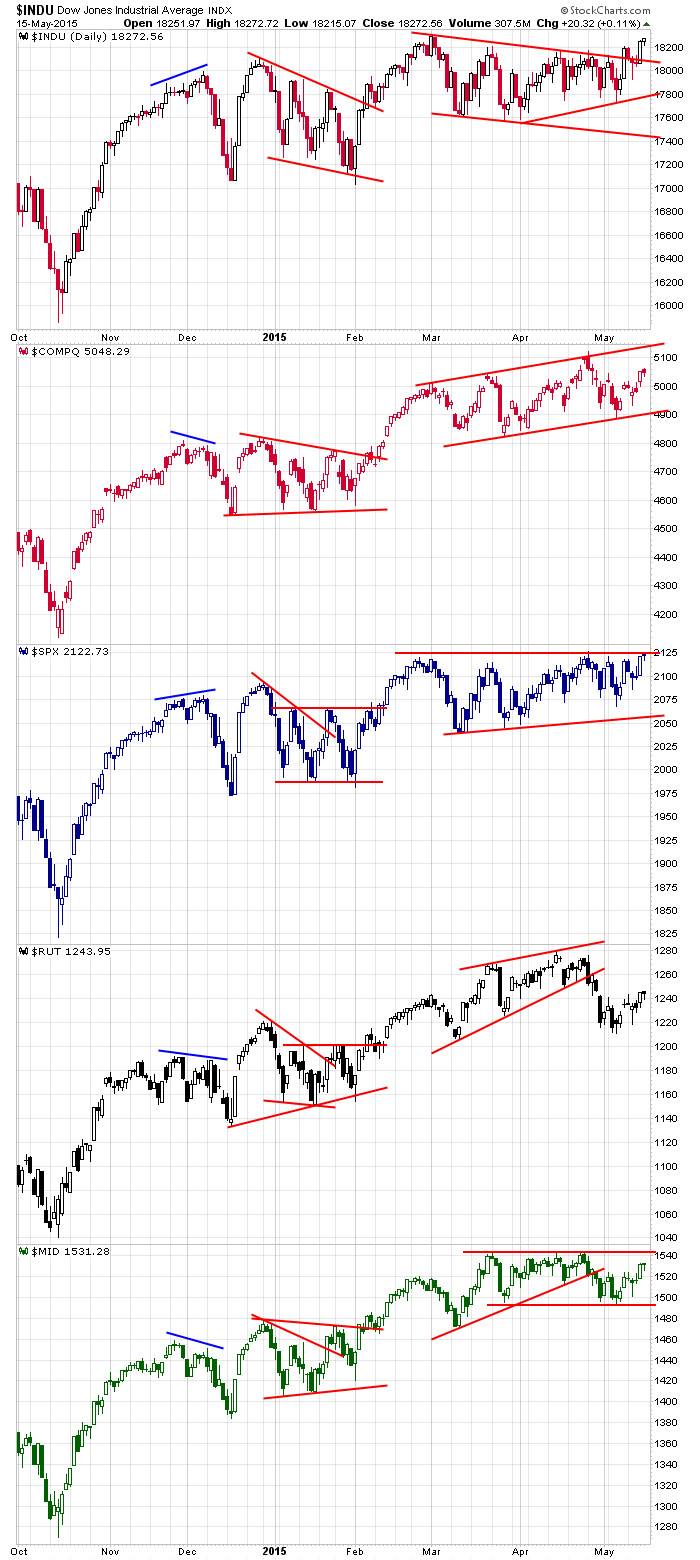
The Dailies: Differences between the indexes are more obvious here. The Dow and S&P are near the tops of their ranges. The Russell is more than 3% behind. The Nas and mid caps are in the middle. No rally will last long without broad-based participation. Herein lies the crux. If the Dow and S&P breakout, will the small caps come along for the ride. If not, the market’s upside will be limited.
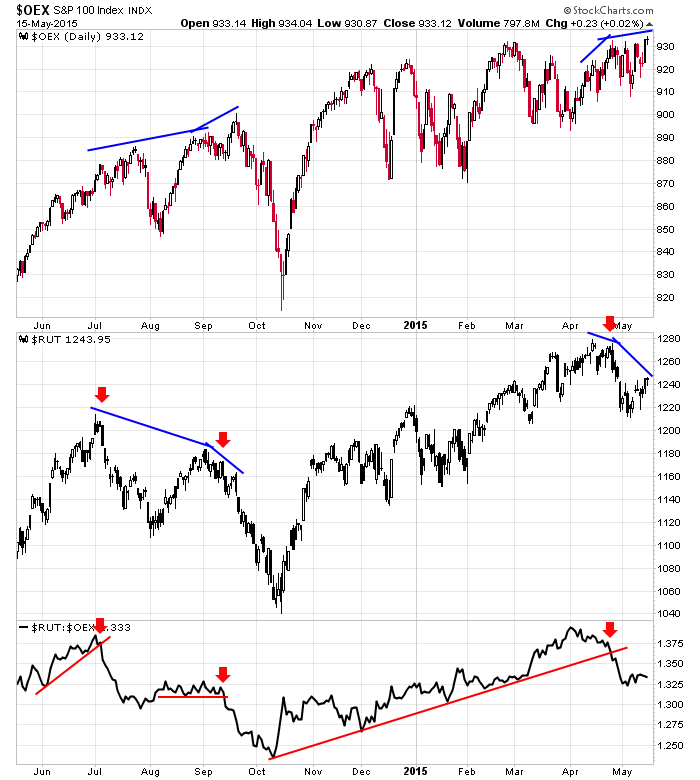
Large Caps vs. Small Caps: Digging a little deeper into the lagging small caps, the market doesn’t tend to do well when the large caps rally and the small caps fail to participate. Such is the current situation.
Indicators
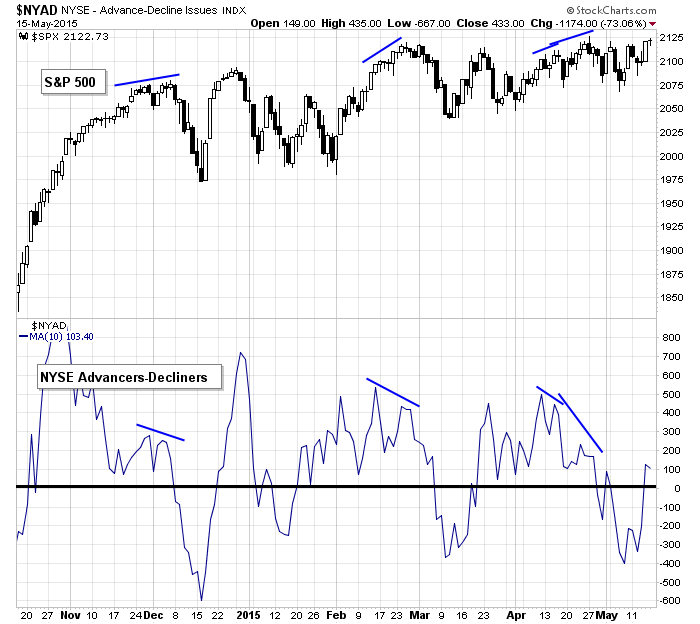
S&P 500 vs. 10-day MA of NYSE AD Line: The AD line put in a little double bottom and then moved up with force last week before taking Friday off. For what it’s worth, this is somewhat similar to the March bottom. Failure to hold above 0 would not be a good sign, especially if the market tried to breakout. The bulls need evidence advancers are beating decliners by a wide margin, not just by a small amount.
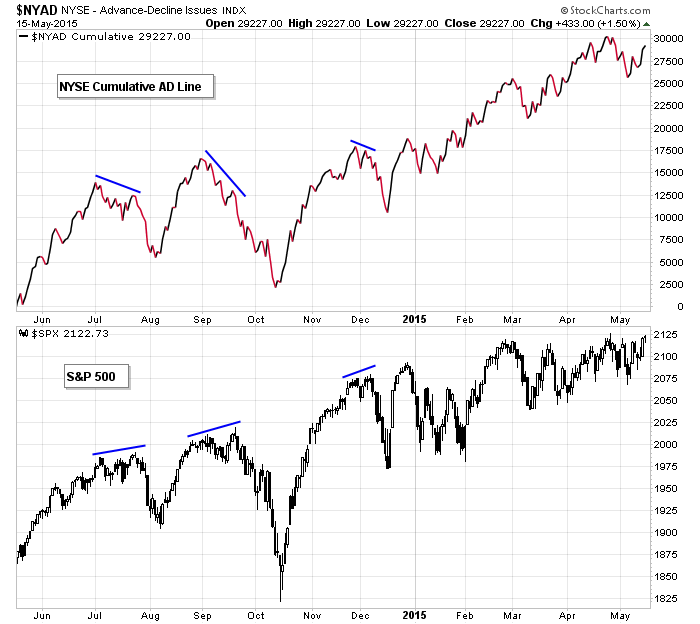
S&P 500 vs. NYSE Cumulative AD Line: If the S&P moves to a new high but the cum AD line fails to do the same, it’ll be a big warning.
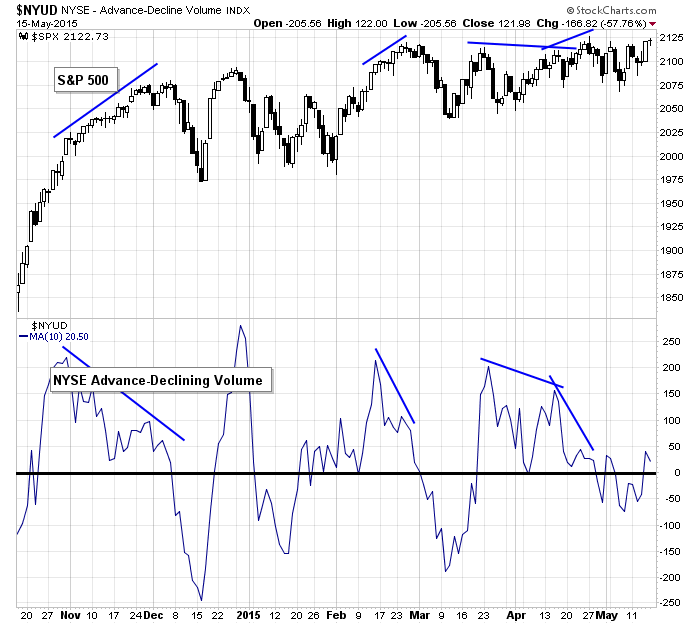
S&P 500 vs. 10-day MA of NYSE AD Volume Line: No surprise the AD volume line has been stuck in the mud the last three weeks – the market has done the same. If a breakout attempt is made, we’ll want to see this indicator shoot up. Absent confirmation increases the odds of a false breakout.
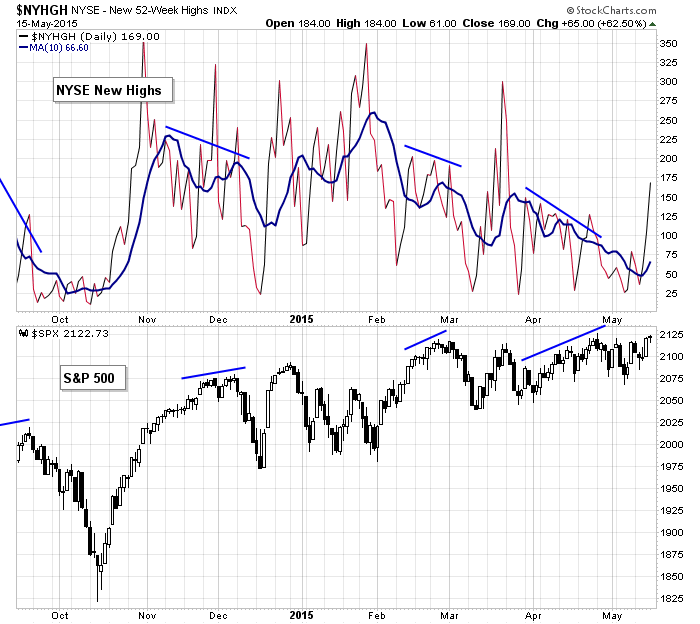
S&P 500 vs. NYSE New Highs: It’s nice to see new highs expand. It doesn’t guarantee anything, but at least the lack of new highs won’t act as a drag.
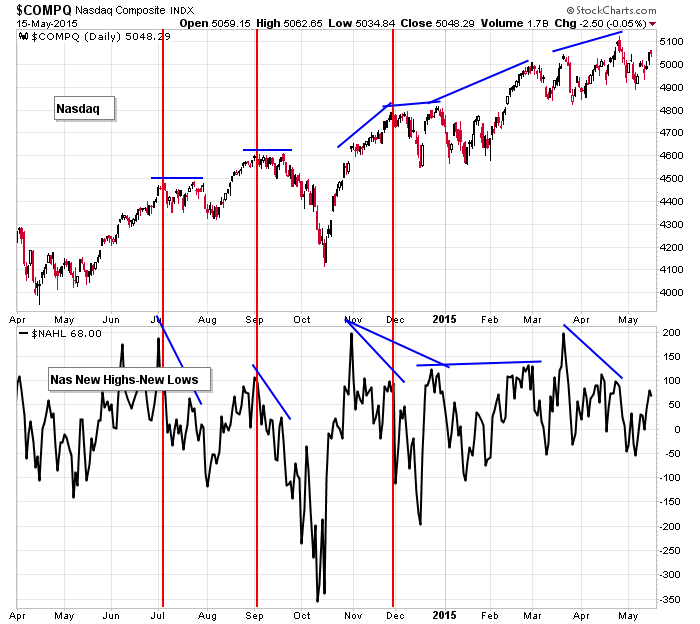
Nasdaq vs. Nas New Highs-New Lows: The difference between Nasdaq new highs and new lows improved last week, but I still want to see the April high get taken out.
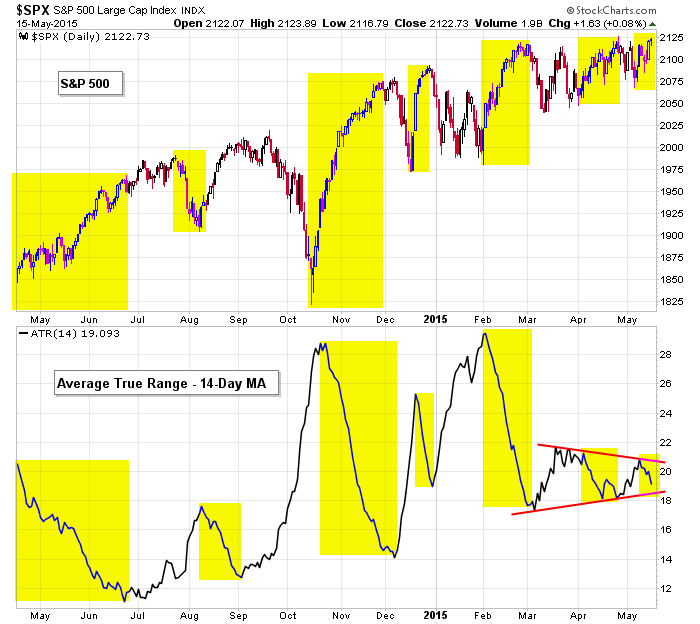
S&P 500 vs. 14-day MA of Average True Range: The market likes to rally on low volatility, so if the S&P attempts to bust out, ideally we’d see the ATR chart take out support – perhaps after a small surge in vol.
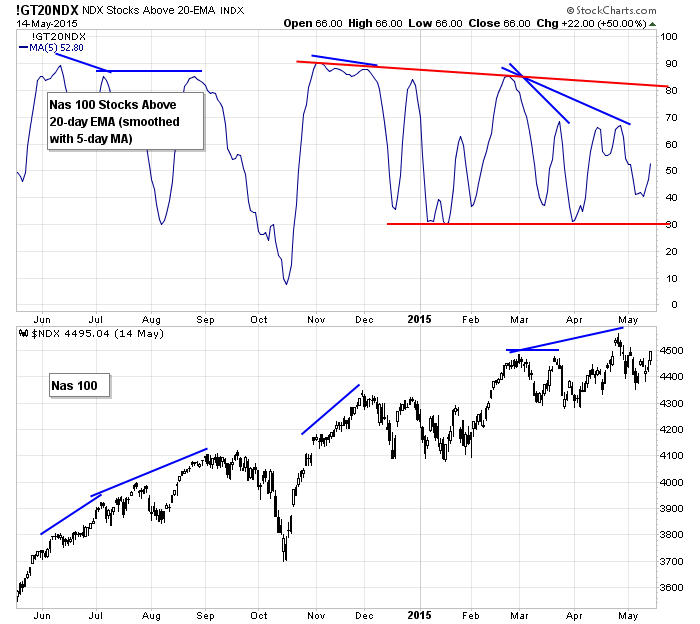
Nasdaq 100 vs. NDX Stocks Above Their 20-day EMAs: The nature of this indicator is it oscillates in a wide range as the underlying market rallies and then rests or corrects. Right now it’s suggesting a lack of participation. The Nas 100 finished last week strong. If this continues, if the index moves up to its high, we’ll want to see this indicator at least get back to the high 60’s.
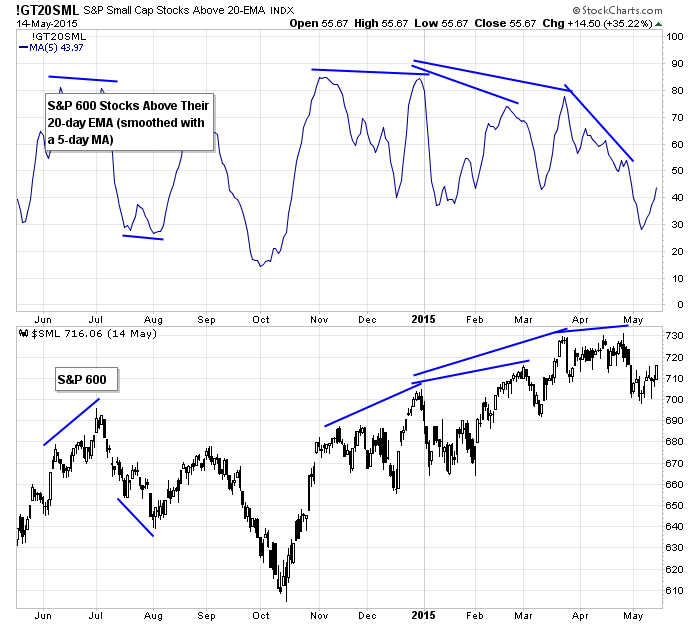
S&P 600 vs. SML Stocks Above Their 20-day EMAs: The percentage of SML stocks above their 20-day EMAs dropped to its lowest level since October. A glass-is-half-full attitude says there’s a long runway ahead, so there’s lots of room for improvement. It’ll be a while before this indicator gets overbought. The potential is there, now the small caps need to fulfill it.
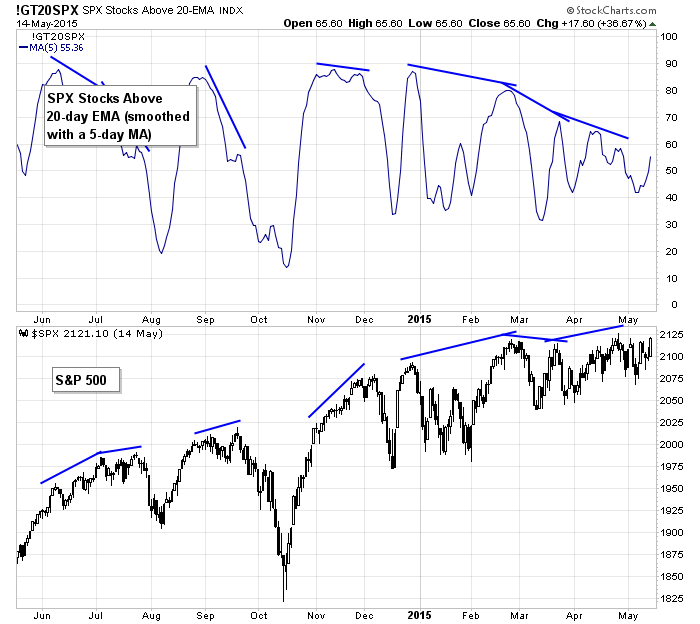
S&P 500 vs. SPX Stocks Above Their 20-day EMAs: The S&P 500 closed at its highest weekly level ever – so by definition it’s above any moving average you could possibly draw – yet the percentage of SPX stocks above their 20-day EMAs is only 55%. Something has to give. If the S&P moves up, we’ll need to see the participation rate increase.
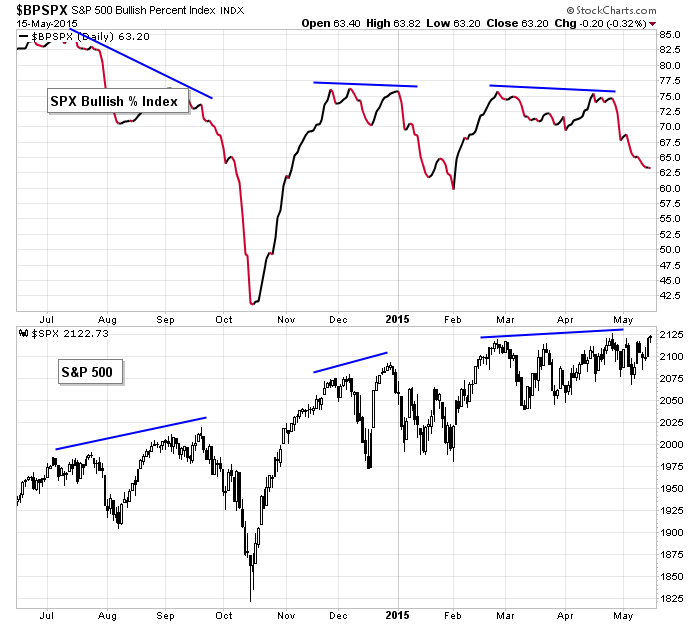
S&P 500 vs. SPX Bullish Percent Index: Another sign of internal weakness, despite the S&P sitting near the top of its range, it’s bullish percent change has been declining for three weeks and is at its lowest level since early February.
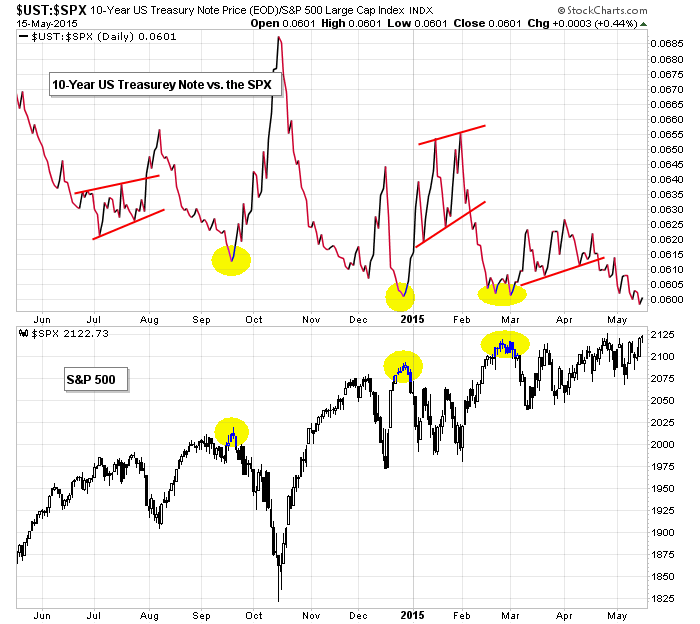
S&P 500 vs. 10-Year US Treasury Note/SPX: Even though the market hasn’t done much the last month, thanks to the sell-off in bonds, this “bonds vs. stocks” chart has suggested investors prefer stocks. But bonds jumped a couple percent Friday. If it continues, it’ll be much harder for the market to move up.
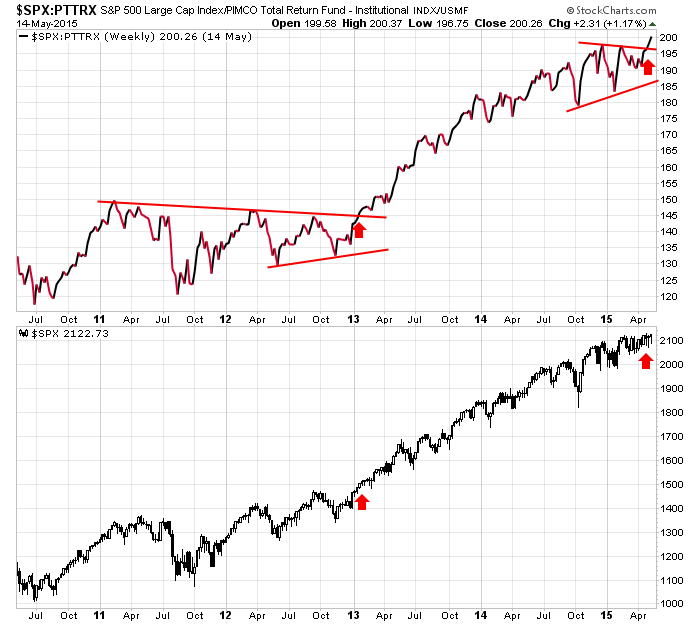
S&P 500 vs. PIMCO Bond Fund: Speaking of bonds vs. stocks, a steady move up from top pane, signalling investor’s preference for stocks over bonds is likely to coincide with the market also moving up.
The Bottom Line
For three straight weeks the market has traded in a range. The small caps have lagged, and many breadth indicators hint at internal weakness.
If the market attempts to bust out and run, we’ll want to see across-the-board improvement. The small caps will need to catch up some and many indicators need to improve.
Absent confirmation, any rally attempt will get faded.
Of course the market could also just continue trading in a range for as long as it wants, do buying dips until it proves unwise isn’t a bad way to go from a trading standpoint.
Have a great week.
Jason Leavitt
0 thoughts on “Weekly Report”
Leave a Reply
You must be logged in to post a comment.
Great weekly report
Thanks Jason
Lara
Great work.
“No rally will last long without broad-based participation. Herein lies the crux. If the Dow and S&P breakout, will the small caps come along for the ride. If not, the market’s upside will be limited.”
I believe that question got resolved during yesterday’s session.