Good morning. Happy Thursday.
The Asian/Pacific markets closed mostly down. Hong Kong, China, Singapore and Australia each dropped more than 1%. Europe is currently mostly down. London, Germany, France, Austria, the Netherlands, Belgium, Sweden, Switzerland, Poland, Finland, Spain and Italy are down more than 1%. Futures here in the States point towards a moderate gap down open for the cash market.
————–
Join our email list and get reports sent directly to you.
————–
The dollar is up. Oil and copper are down. Gold is down, silver is up. Bonds are mixed.
Today is the last day of trading this week. Absent a solid rally off the opening gap down, the market’s 5-week win streak will end. So far the range, volume and energy levels have been low – the lowest of the year. In the grand scheme of things you could argue this is just a rest within an uptrend, but given the warnings when the week began and the fact that the market is in a 2-year range, warnings should be watched from the sidelines, not with a lot of exposure.
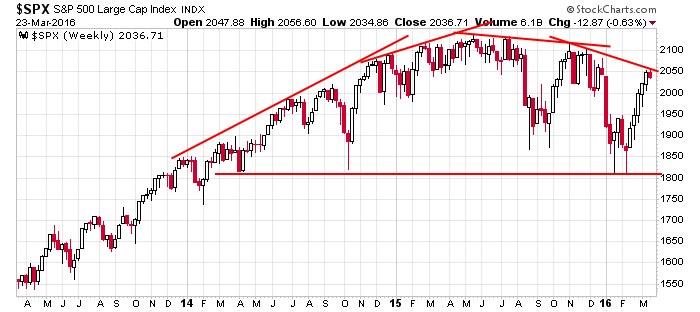
Here’s the weekly S&P going back three years.

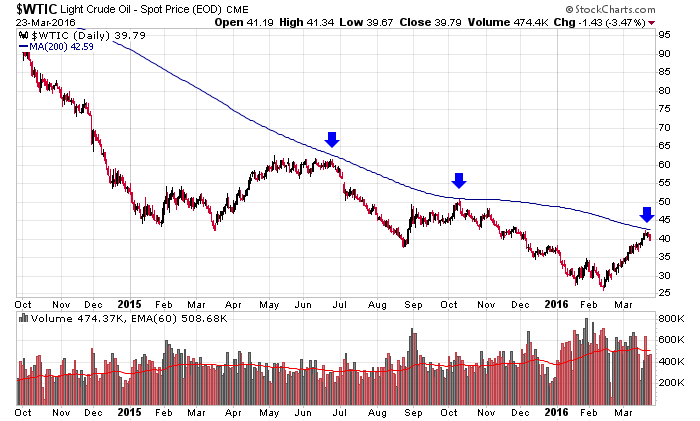
Oil rallied right up to my target and is now pulling back. Again, maybe oil could have shot higher, but when you get a 50%-plus run right up to a significant level, you take profits and wait for the market to reveal its cards. Here’s the daily.

The market is closed tomorrow, so to some degree we have to give some thought to traders’ desire to hold over the long weekend. Are there higher odds of good news or bad news to come out this weekend? We’ve been in a defensive posture all week, and I intend on staying there.
Stock headlines from barchart.com…
Wells Fargo (WFC -1.21%) was rated a new ‘Sell’ at UBS With a price target of $45.
General Dynamics (GD -0.68%) was downgraded to ‘Hold’ from ‘Buy’ at Deutsche Bank.
Concordia Healthcare (CXRX -2.56%) reported Q4 adjusted EPS continuing operations of $1.24, below consensus of $1.30.
T-Mobile (TMUS -0.56%) was rated a new ‘Buy’ at FBR Captal with a price target of $40.
Dollar General (DG +0.73%) said that it will open 900 new stores in 2016 and 1,000 in 2017.
H.B. Fuller (FUL -2.26%) reported Q1 adjusted EPS of 43 cents, above consensus of 39 cents, although Q1 revenue of $474.3 million was below consensus of $477.8 million.
Sportsman’s Warehouse Holdings (SPWH -1.29%) dropped 7% in after-hours trading after it said it sees fiscal year EPS of 65 cents-73 cents, below consensus of 75 cents.
Oxford Industries (OXM -2.79%) lowered guidance on fiscal year adjusted EPS to $3.75-$3.95, below consensus of $3.99.
PVH Corp. (PVH -1.53%) rose over 3% in after-hours trading after it reported Q4 adjusted EPS of $1.52, above consensus of $1.46, and said it sees Q1 adjusted EPS of $1.40-$1.45, well above consensus of $1.33.
KB Home (KBH -3.82%) rallied over 7% in after-hours trading after it reported Q1 EPS of 14 cents, higher than consensus of 11 cents.
Lannett (LCI +0.15%) lost 1% in after-hours trading after it lowered guidance on fiscal 2016 net sales to $555 million-$565 million from a prior forecast of $585 million-$595 million, below consensus of $582.2 million.
Office Depot (ODP +2.09%) climbed nearly 9% in after-hours trading after the judge handling the Federal Trade Commission’s (FTC) lawsuit to prevent Staples’ planned merger with Office Depot rebuked the FTC over its legal tactics and accused them of pressuring Amazon to provide favorable testimony.
Terex (TEX -2.78%) jumped 10% in after-hours trading after it received a revised $31-a-share bid buyout offer from Zoomlion.
Vitae Pharmaceuticals (VTAE -4.27%) slipped 2% in after-hours trading after it started a secondary share offering via Piper Jaffray and BMO Capital Markets.
Reeds (REED -1.11%) slumped over 10% in after-hours trading after it reported a fiscal 2015 loss of -30 cents, a bigger loss than consensus of -28 cents.
Earnings and Economic Numbers from seekingalpha.com…
Wednesday’s Key Earnings
KB Home (KBH) +8.5 AH after strong fiscal first quarter.
Today’s Economic Calendar
8:30 Durable Goods
8:30 Initial Jobless Claims
9:45 PMI Services Index Flash
9:45 Bloomberg Consumer Comfort Index
10:30 EIA Natural Gas Inventory
11:00 Kansas City Fed Mfg Survey
4:30 PM Money Supply
4:30 PM Fed Balance Sheet
Today’s Earnings here
Other…
today’s upgrades/downgrades from briefing.com
this week’s Earnings
this week’s Economic Numbers
0 thoughts on “Before the Open (Mar 24)”
Leave a Reply
You must be logged in to post a comment.
Duck the stuff is hitting the machine today. The US econ reports are very negative today; economy is slowing. A day to hook up the shorts? Long week end with plenty of bank confusion in the US. But EU banks are looking weaker and for good reason, their debts are serious and untended. Overall, its not clear where the precious metals are going, well, down right now, but later look for a rally. The lunar eclipse today correlates with a correction about 80% of history. Have a nice day.
the trend is down and this corrective up is merely the right shoulder to a rounded head and shoulders
going back to 2014
the corrective up is either ended today or with one small push up to 2060-70
i fancy one more small push up but will trade the trend of the 2 and 5 minute charts
We are are going to be in a trendless market environment with big swings in the VIX. Currently the VIX is trading below the long term average 20. In my perspective I see 19.55 to be pivotal equilibrium area closely confluent with the long term average. The market at the very least has no formal direction. Here is the likely scenario.
I will start from zooming into the January barometer a classic wall street saying, “As Goes January, So Goes The Year”. This old saying will continue to offer sound predictions in the year ahead, since it mirrors investor behavior. The following is excerpted from Owen Williams,CFA via Seeking Alpha article titled, “Seasonality Super Cycle: January Barometer in the 4th Year of the Presidential Cycle.
Since 1945, there have been 44 positive January closes on the SP500 and 27 negative January closes. Of the 44 years with an “up January”, the SP500 managed to finish the year in positive territory 38 times, a batting average of 86.4%. Of the 27 years with a “down January”, SP500 indeed finished the year negative 55.6%. The sharply lower January 2016 close for U.S. equities has therefore understandably created anxiety among investors. While U.S equities are in a “Negative January Barometer” year, we are also in the 4th year of the U.S Presidential cycle. Financial markets continue to follow the Presidential Cycle with higher uncertainty in the 4th year of a presidential term, as a new administration is certain. Overlaying the negative January annual cycle on the 4 year Presidential Cycle combines itself into a Super Cycle. The aforementioned 55.6% “sucess rate” of predicting a negative year for equities based on a lower January close becomes a 100% sucess rate in election years.
Zooming out into the SP500 index (SPX) quaterly chart (3month chart) there is a major wedge pattern. And if you pay attention to detali the market seems to be exhausted. Dec.31,2015 (Oct.,Nov.,Dec.) candlestick failed to engulf prior candlestick followed in reverse by back-to-back dojis. With current price at around 2028 January 2016 open at 2038.20. We have today and 4 days of trading next week for the first quarter March 31 to close out at or above 2038.20 (about 10 points away). Looking at the technical indicators CCI14 along with +DI114/-DI14 which are bound to diverge are indicative of a market breakdown. 38.2% Fib. retracement level happens to be confluent with pivoted points 1552.87 & 1576.09 area.