Relative Strength Index, or RSI, is a momentum oscillator that compares a stock to itself. It oscillates between 0 and 100, with 30 being considered oversold and 70 considered overbought. Signals are offered via divergences, center line crossovers and classic charting principles.
—————
FREE Online Course: Jason Leavitt’s Mini Masterclass in Trading
—————
The indicator is calculated by taking the average gain and average loss over a given number of periods, plugging them into a simple formula and smoothing it, similar to how an exponential moving average is calculated, where a new data point is averaged into the existing average. This means the RSI will reflect data from months prior to the period studied. Because of this, RSI may appear different on different charting platforms, depending on how far back the calculation was begun.
Most charting platforms use 14 as the default setting, but this can be increased to decrease the sensitivity or reduced to raise the sensitivity. The indicator can also be applied to multiple timeframes, so while 14 may be the best setting for a daily chart, a different setting may be more appropriate for an hourly chart. Traders should experiment with different settings on different time frames to see what suits their trading style best.
A reading above 70 is considered overbought while a reading below 30 is considered oversold. But overbought and oversold can stay that way for a while, so a simple reading is not sufficient to make trading decisions. The overall trend should be taken into consideration. Here’s an example of RSI shown on a chart. Then various uses the of indicator are shown.
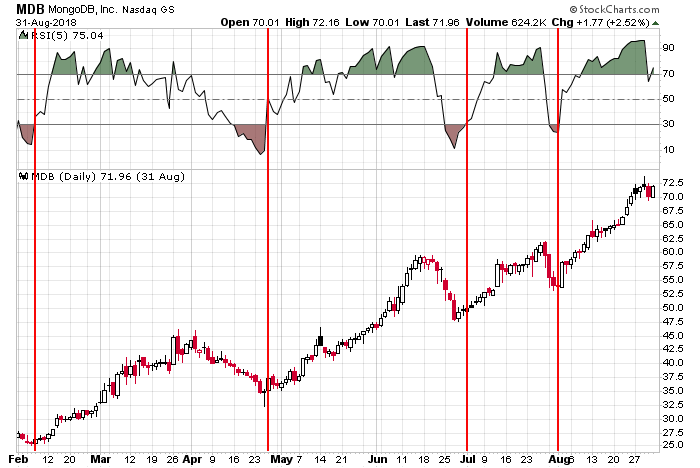
Here’s a simple example of how RSI can act while a stock rolls up and down within an uptrend. The RSI(5) trended up and stayed in overbought territory while the stock trended up and then rotated down to oversold territory during mini pullbacks. Buy signals were generated when the RSI move back above 30.
Divergences
A divergence forms when the RSI does not match the underlying price movement. A positive divergence forms when price drops to a lower low while the indicator puts in a higher low. The ability of the indicator to resist dropping is a hint the downside momentum is slowing. A negative divergence forms when price puts in a higher high while the indicator puts in a lower high. The inability of the indicator to match the price movement suggests upside momentum is waning, so traders should be on the lookout for a reversal. Divergences tend to work well with a stock that is rolling up and down, not with a stock that is strongly trending. Also, traders should be aware successive divergences are common.
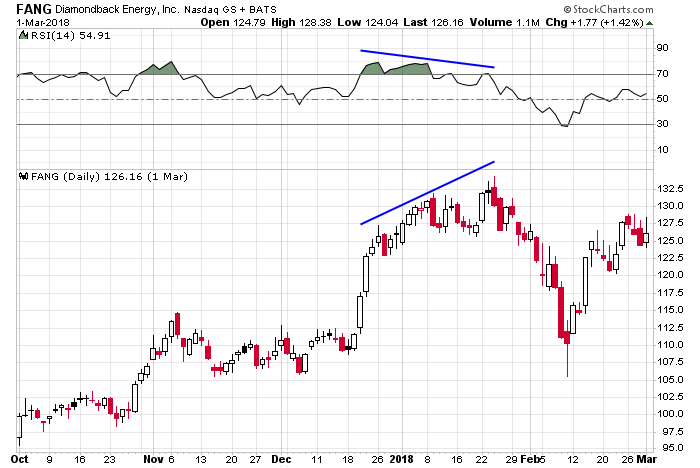
FANG formed a negative divergence at the end of 2017 and beginning of 2018. The stock pushed higher in early and late January while the RSI(14) put in lower highs. This lack of confirmation told us the rally was likely to at least stall and possibly reverse.
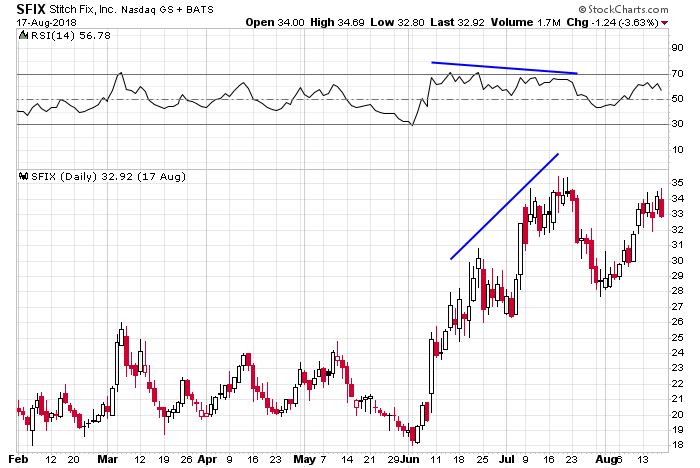
SFIX broke out of a base and rallied up to a new high. But a negative divergence formed in June and July, suggesting the upside was limited. This doesn’t mean the stock is going reverse hard and crash; it just means the stock is likely to continue up without at least resting or correcting some. From a trading perspective, stops need to be move to protect gains, and initiating a new trade would not be wish until the chart and the indicator can reset.
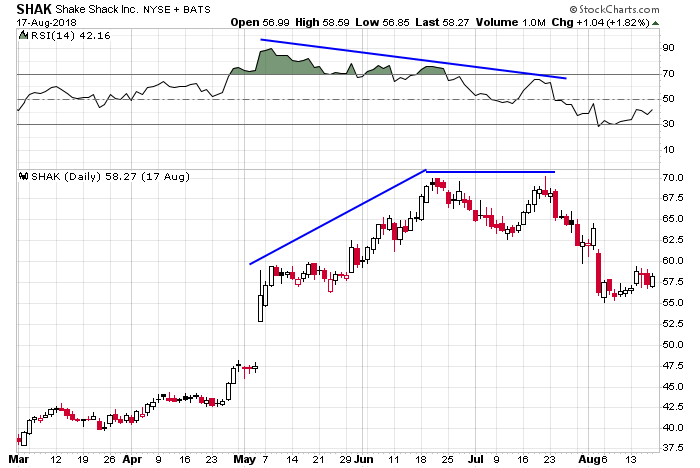
SHAK formed a negative divergence in May and June, which led to a 10% pull back. Then the stock attempted to take out its high, but the RSI(14) wouldn’t confirm the price action. If you’re long in this situation, you need to be very careful. Stops should be moved up to protect gains, and new trades should not be initiated.
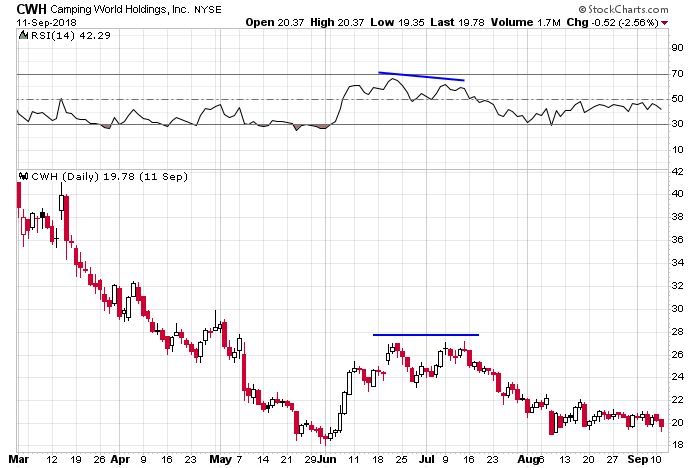
CWH was a weak stock in a downtrend when it attempted to reverse its trend in June 2018. But a negative divergence formed with its RSI(14), so the stock went no further. In this case, the divergence was used to signal the end of the bounce attempt and continuation of the overall downtrend.
Positive-Negative Reversals
A positive reversal forms when the RSI drops to a lower low while the underlying price puts in a higher low. The RSI low is not at an oversold level; instead is typically between 30 and 50. A negative reversal forms when the RSI puts in a higher high while the underlying price fails to match the movement. The RSI high is not typically at an overbought level; instead if tends to fall somewhere between 50 and 70. This is more apparent in the examples below.
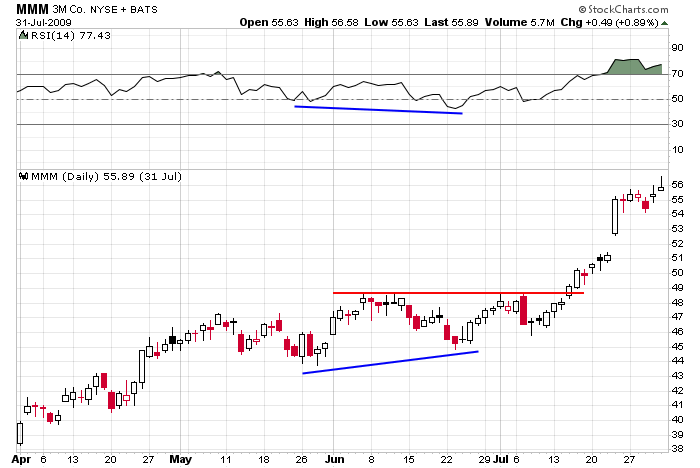
MMM formed positive reversal with its RSI(14) in June of the chart shown. While the indicator dropped to a lower low, the stock put in a higher low. After bouncing and solidifying resistance, the stock eventually broke out and rallied hard.
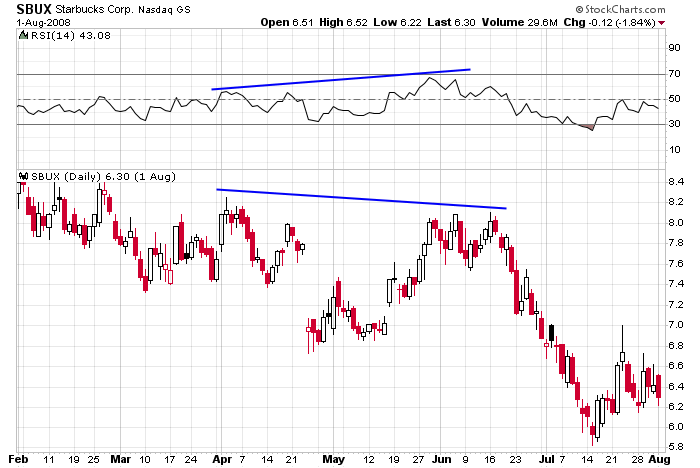
SBUX formed a negative reversal with its RSI(14) in June shown. The indicator pressed higher while the stock failed to match the movement. The divergence led to the stock eventually suffering a sizeable drop.
Failure Swings
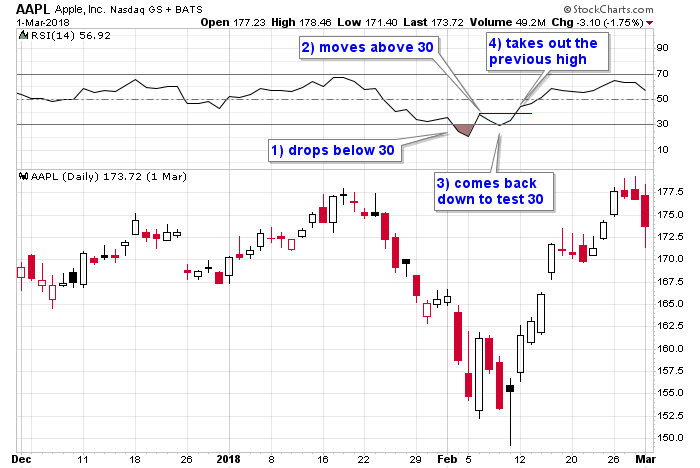
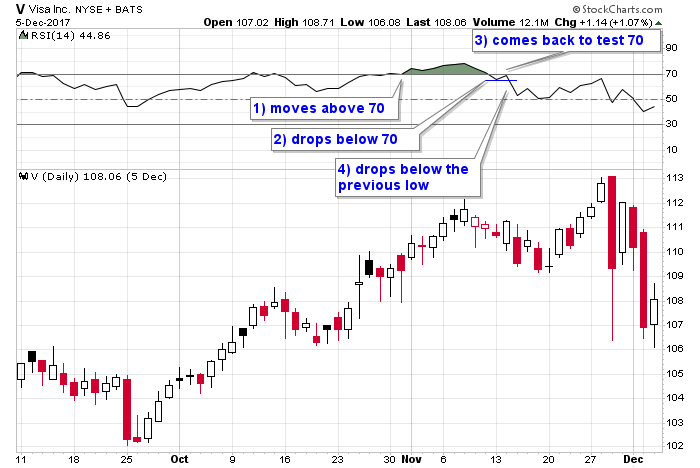
Failure swings are a simple charting formation that suggests an impending reversal, be it up or down. A bullish failure swing takes place when the RSI falls below 30, recovers above 30, drops to test 30 and the moves up to take out the prior high. A bearish failure swing is the opposite. The RSI moves above 70, falls below 70, and then after testing 70 from below, drops to take out the previous low. If it’s acceptable to use simple charting formations like failure swings to identify low-risk entries, other charting techniques should also be considered. This will make more sense with the examples below.
AAPL suffered a setback in January and February 2018 (within an overall uptrend). A bullish failure swing then formed in February when the RSI(14) dropped below 30, moved back above 30, came down and tested 30 and then took out the just-printed high. This signals the move down was likely over.
Visa was trending up when it formed a bearish failure swing. The RSI(14) moved above 70 and the dropped back below. An attempt to move up failed, and then the indicator took out the low. The stock proceded to drop, but because the trend was so strong, the pullback didn’t last long or go far. Traders should pay close attention to the overall environment. Within a downtrend this signal is likely to pay handsomely, but within an uptrend, the drop was muted.
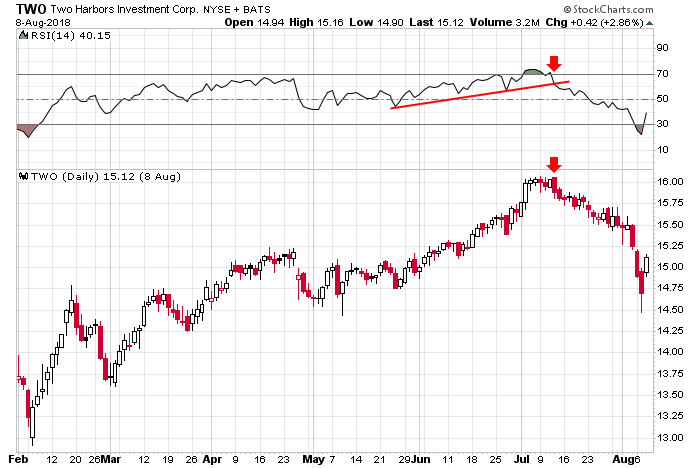
While technically not a failure swing, trendlines breaks have a decent track record hinting at reversals. In this case, TWO pushed high along with its RSI(14), but when the indicator dropped from overbought territory and then took out a support trendline, a message was given to tighten up stops on longs and be on the lookout for a possible reversal.
Trend Confirmation
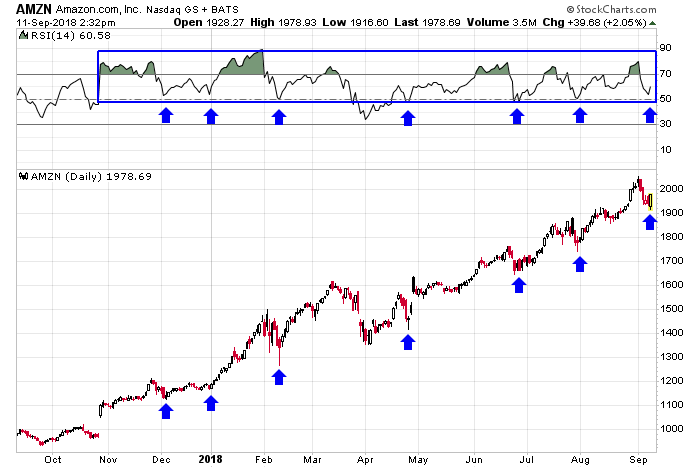
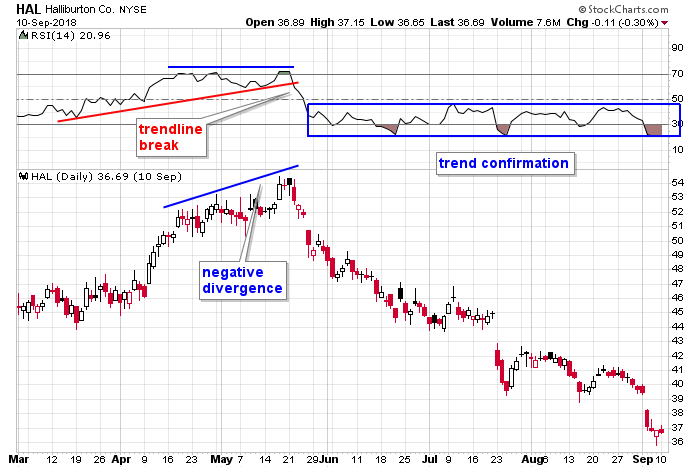
RSI works best with rolling stocks, not with trending stocks that can remain overbought or oversold of for extended periods. But there are are RSI readings that can be used to confirm a trend. While up-trending, an RSI reading between 40-90 is typical, with the 40-50 area acting as support. While down-trending, an RSI reading between 10-60 is usual, with the 50-60 area acting as resistance. In fact low risk entries can be had at the support and resistance levels while the trend remains in place. Here are examples.
AMZN spend the latter part of 2017 and the first eight months of 2018 trending up. Other than a dip below the centerline in March and April, the RSI(14) oscillated between overbought territory and the centerline during the entire trend. The movement of the indicator confirmed the stock’s trend.
HAL nearly formed a negative divergence n April and May, and then the RSI broke a trendline, signaling a possible end to the mini rally. Then while the stock trended down, the indicator oscillated between oversold territory and the centerline, never giving any indication the stock’s downtrend would end.
Combinations
The techniques discussed above don’t only work in isolation; they work in tandem or in succession. Here are few examples where one signal was followed by another.
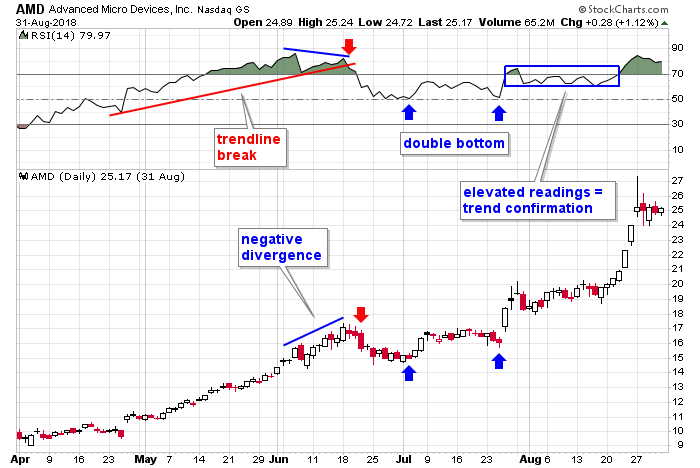
AMD steadily trened up April – mid June. Then a negative divergence formed, and soon after, a trendline was broken. This isn’t a reason to go short because the trend is so strong, but it is a reason to lighten up on longs and resist initiating new long postions. Then the RSI dropped and did a double bottom at the centerline. This gave the stock enough time to rebuild its strength and get ready for the next rally attempt. After popping in late July, the RSI held steady in a range at an elevated level. This confirmed the uptrend and told traders to sit tight with their long positions. The stock then continued higher.
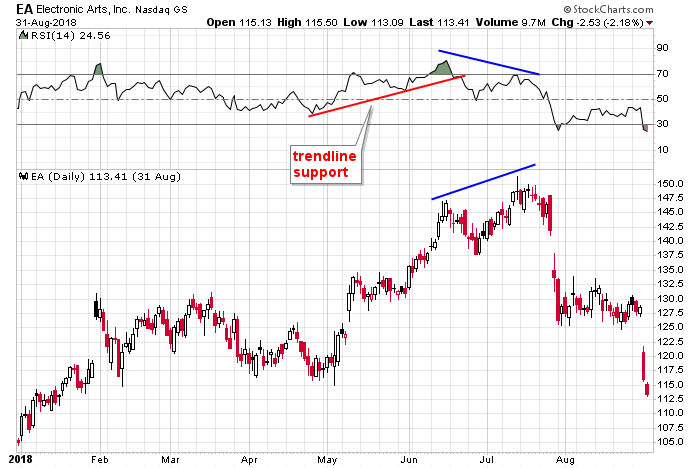
The RSI(14) of EA broke a trendline in June 2018. The stock dipped but then resumed its uptrend and put in a higher high. But this highwas not matched by the indicator, which got turned back at a lower level. The trendline break was warning #1. The negative divergence was warning #2 that the uptrend had limited time left. This doesn’t mean the stock had to fall hard, just that traders would be wise to book profits or move stops up.
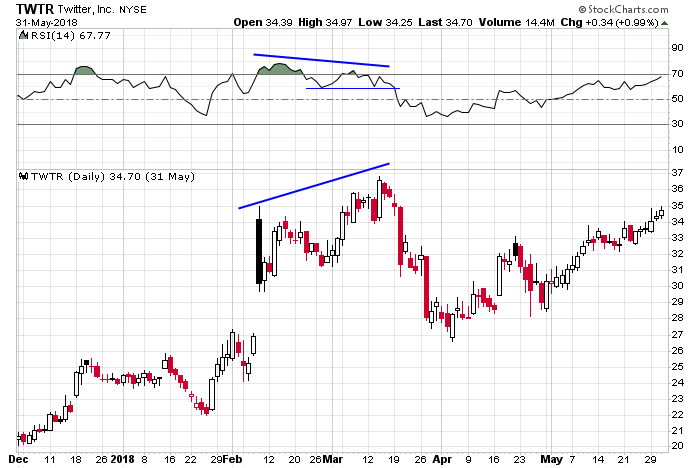
TWTR formed both a negative divergence and a bearish failure swing in February and March 2018. The divergence is obvious. The failure swing is spread out over a few weeks. The RSI moved above 70 and then back below 70 two weeks later. Then it barely got above 70 again in early March before dropping to take out is late-February low. Long traders need to protect capital when this happens.
This write-up is a work in progress. More examples will be posted. Join our email list. Be alerted of new content.
4 thoughts on “RSI – Everything You Need to Know”
Leave a Reply
You must be logged in to post a comment.
Very nice. Beautiful article
Would suggest a back test of these patterns over a universe of stocks to know the probability of these patterns playing out. Examples can be found where the patterns work and there are many times when they do not. Important to know the trade expectancy.
According to your divergent definition (positive divergence is higher prices while the indicator fails to show higher values), then FANG, SFIX, SHAK, and others should be ‘positive’ divergences? (not negative)
Am I understanding what you wrote correctly?
Hi MIk…You are right. I had them mislabeled. The error has been fixed. Thanks.
Jason