Stochastic Oscillator is a momentum oscillator that shows where an entity has closed relative to its high-low range over a given number of periods. Signals are given via signal line crossovers, crosses from oversold or overbought territory, crosses of the center line and divergences. It’s especially useful identifying low risk areas to buy within an uptrend and short within a downtrend.
—————
FREE Online Course: Jason Leavitt’s Mini Masterclass in Trading
—————
The indicator is displayed as two lines. It’s calculated by dividing the distance an entity is from its lowest low over a given number of periods by the range over the same number of periods. For example, if a stock trades between 50 and 55 over a given time period and then closes at 54, the Stochastic would be 0.8, or 80% (4 / 5 = 0.8). This is the first line, typically noted %K. The second line, noted %D, is the moving average of the first line. This is what’s called Fast Stochastic.
A slower version of Fast Stochastic, called Slow or Full Stochastic, is also used. It takes the %D from the Fast Stochastic and uses it as its %K and then does a moving average of it to calculate its %D.
So while the Fast Stochastic uses a single data point from the price chart and a moving average, the Slow Stochastic uses a moving average and a moving average of the moving average.
Here are a couple charts to illustrate, before we get into how the indicator can be used.
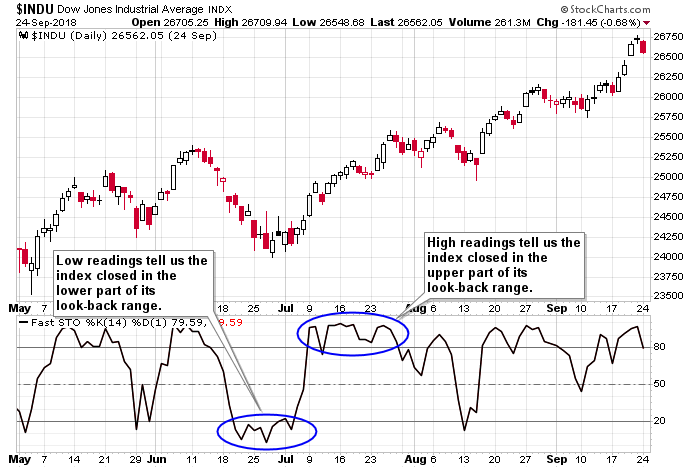
Here’s is the Dow daily with a Fast Stochastic (14). This means a 14-day period is used as the look-back period. The highest high and lowest low of this period is used in the calculation. Low readings tell us the index closed near the bottom of its 14-day range while higher readings tell us the opposite, that the index closed in the upper part of its range.
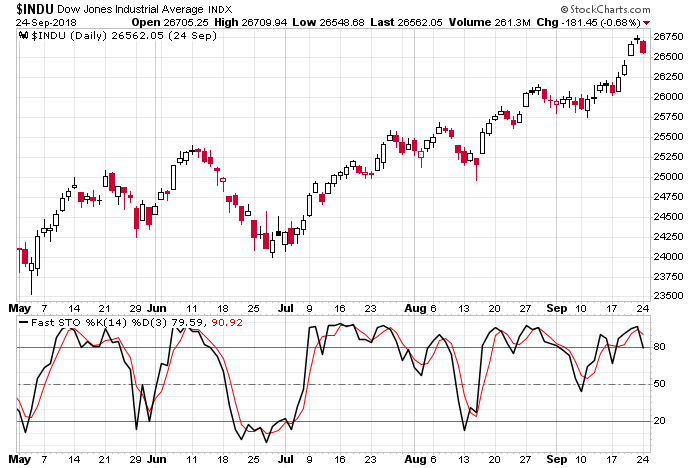
Here’s the same chart with a Fast Stochastic (14,3), so it’s the same as above, but with a second line added, which is the 3-day moving average of the first line. You can see %D line smooths out the %K line.
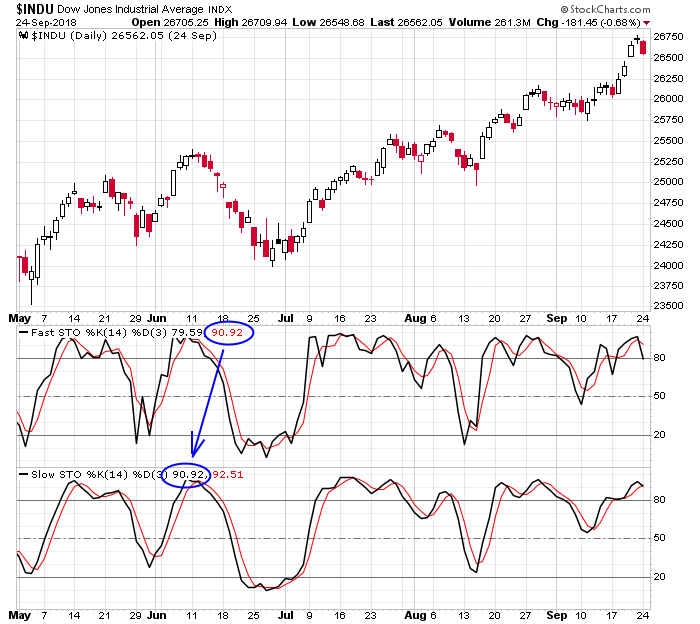
Same Dow chart, except both a Fast and Slow Stochastic are displayed. Notice the %D of the Fast Stochastic is the %K of the Slow Stochastic.
For those who believe closing prices are more important than any other prices prints, Stochastic is a great indicator because it only uses closing prices, and it ignores the intraday gyrations, unless those moves produce a high or a low over a given look-back period.
At the risk of stating the obvious, the length of the look-back period, along with the moving average used, can drastically change the signals. A shorter look-back period will be produce a volatile indicator while a longer look-back period will come with slower movement and less volatility. Neither is inherently good or bad, but matching a stock’s personality with the indicator setting is needed. The default settings tend to be (14,3). These can be lengthened or shortened and of course they can be applied all time frames, including monthlies, weeklies, dailies and intraday charts.
Also, Stochastic is an oscillator that moves between 0 and 100, so with it being mathematically impossible to move outside these bounds, divergences need to be taken within context.
Here are some uses of Stochastic.
Overbought/Oversold
Stochastic ranges from 0 to 100. Readings near or above 80 suggest the underlying is near the top of its range (overbought) while readings near or below 20 suggest the underlying is near the bottom of its range (oversold).
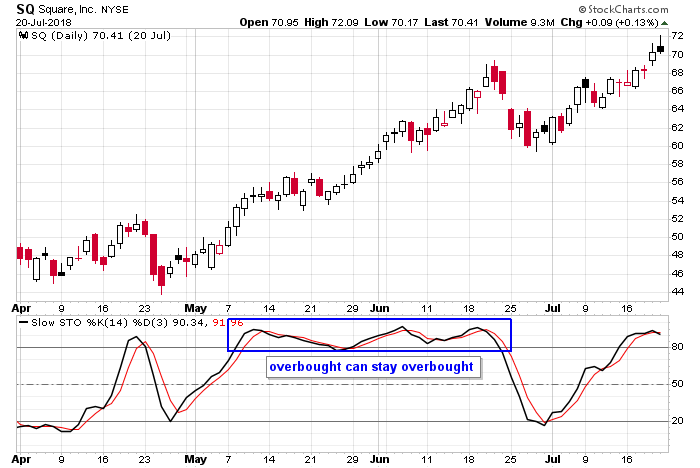
Within an uptrend, overbought readings should be mostly ignored because overbought can stay overbought for long periods. But oversold readings within uptrends are often reliable signs the trend, having undergone a temporary dip, is ready to resume.
Within a downtrend, the opposite principle applies. Oversold readings should mostly be ignored because oversold can stay oversold for a long time. But overbought readings within downtrends are often reliable signs the trend, having undergone a temporary rally, is about to continue.
First examples of the Stochastic staying overbought and oversold are show below. Then examples using Stochastic to determine a disrupted trend is going to reassert itself are discussed.
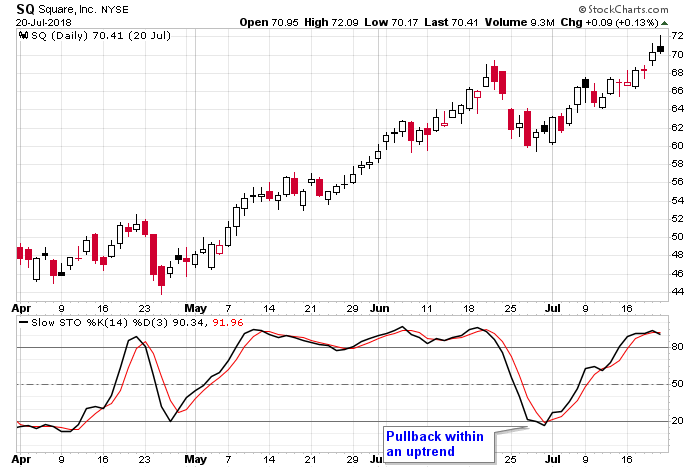
SQ steadily trended up during most of May and June, and once the Stochastic got to an overbought level above 80, it remained there. In this case, the elevated reading confirms the trend and likelihood it will continue.
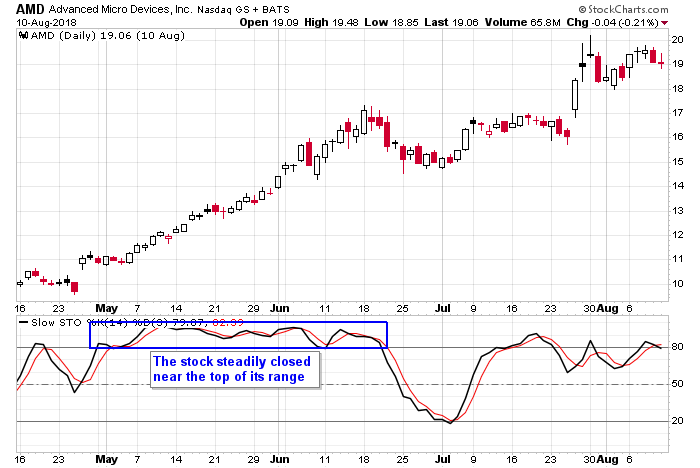
AMD trended up May and the first half of June. The Stochastic confirmed the trend by rolling up and down in overbought territory.
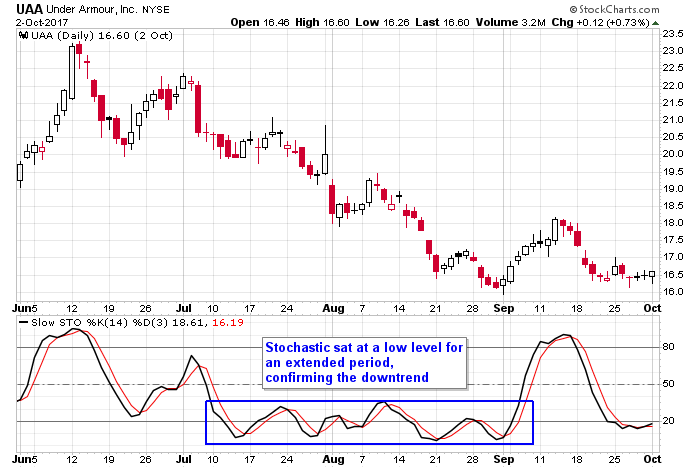
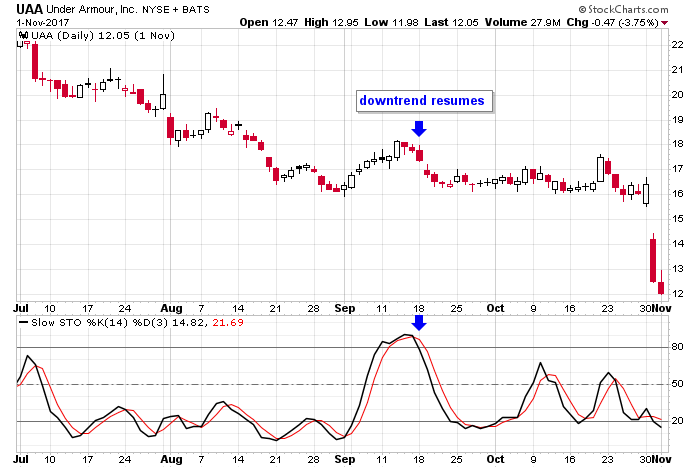
UAA broke a support level in June and then began a downtrend that didn’t end until the Stochastic climbed out of its base. The indicator didn’t stick below 20, but it did roll up and down in a range at a low level. This confirmed the downtrend.
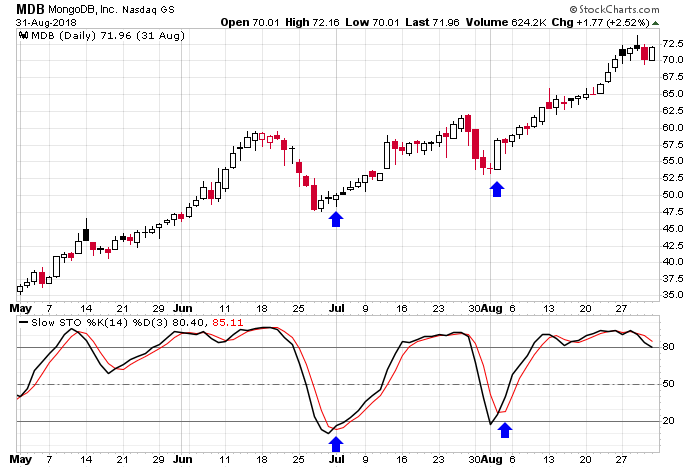
MDB was a strong stock in a steady uptrend. Twice it dipped near term within its overall trend, and each time an oversold Stochastic reading helped time a “buy the dip” entry.
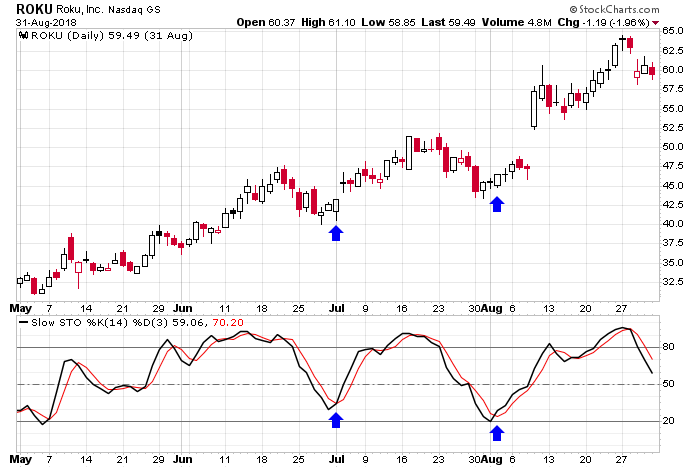
ROKU wasn’t an extremely smooth-moving stock, but buyable dips within its overall uptrend were identified when the Stochastic dropped near 20 and then started to rebound.
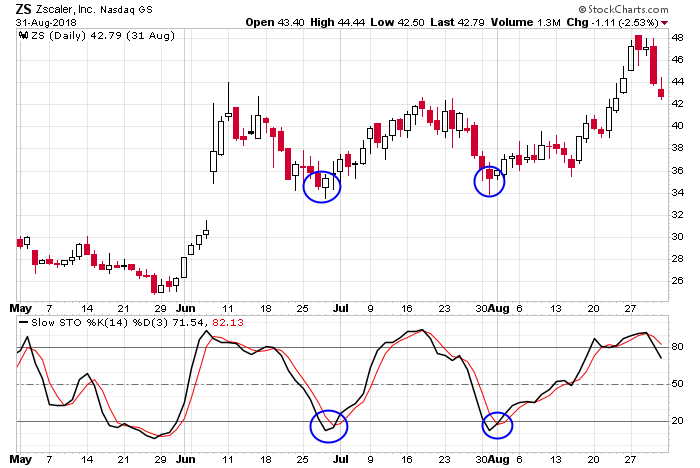
ZS surged in early June, and then while the stock rolled up and down in a range for 2+ months, two oversold Stochastic readings helped traders buy dips within the range.
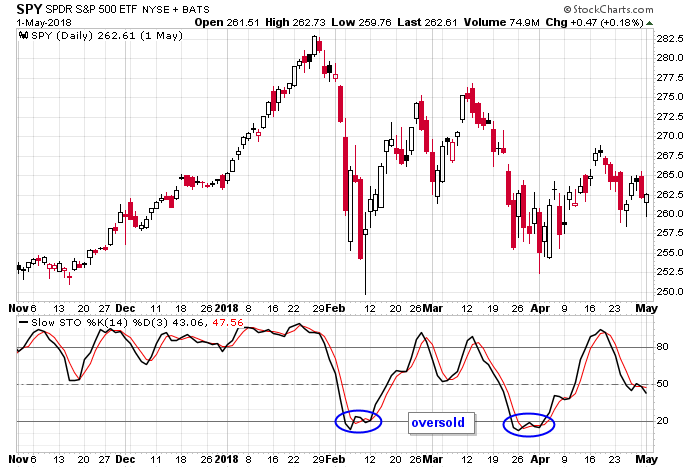
The S&P 500 rallied huge heading into the end of January 2018. The index proceeded to trade up and down in a large range for several months. For traders that use Stochastic, bottoms formed when the indicator rebounded from the oversold levels shown. The market was volatile at the time, so an exact entry was not easily discernible. But at least traders had a framework to work with.
After SQ trended up for two months and its Stochastic sat in overbought territory, the stock dipped while the indicator cycled down to and oversold level at 20. When it turned back up, it classic “dip within an uptrend” was available.
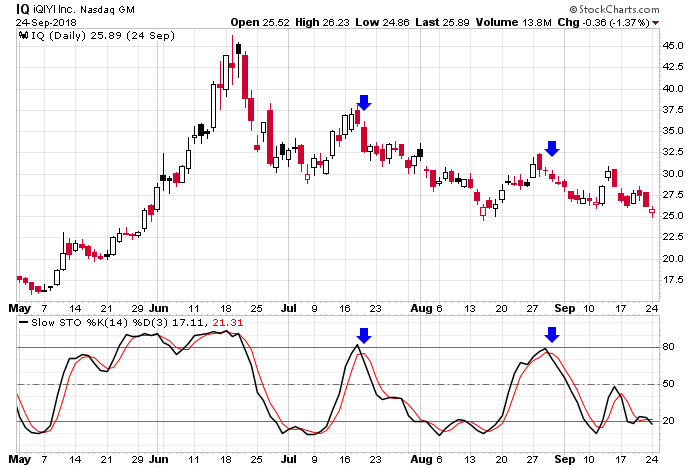
IQ broke down in June. Then, while the stock trended down, each time the Stochastic cycled up to an overbought level near 80, aggressive traders were given short signals.
UAA was steadily trending down. The September bounce, which was nothing more than a bounce within a downtrend, offered a good place to initiate a short position.
Dips Within Uptrends, Pops Within Downtrends
Dips within uptrends and pops within downtrends are very similar to oversold and overbought signals discussed above – the difference being overbought and oversold look for Stochastic moves to 80 and 20, whereas dips and pops can move to nearly any level and reverse. In particular, reversals at the center line (50) are significant because they tell traders the underlying has remained in the top half or bottom half of its range.
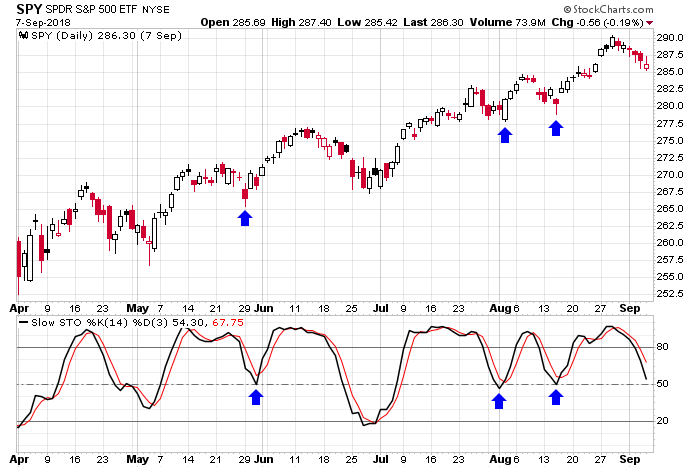
While the S&P 500 zig-zagged up and down within an uptrend, the Stochastic of SPY successfully tested its center line three times. Each instance signaled the end of a temporary dip within the broader uptrend.
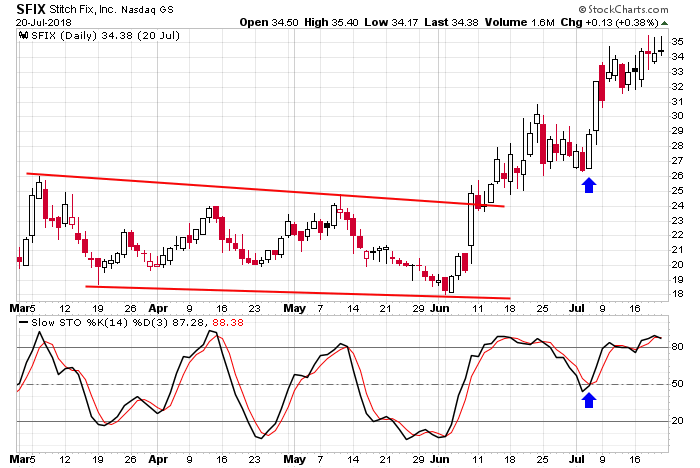
SFIX broke out of a multi-month base and rallied from the mid 20’s to about 30. It’s Stochastic fell from overbought territory and cycle down to its center line, where if found support and curled up. Classic dip within a newly formed uptrend.
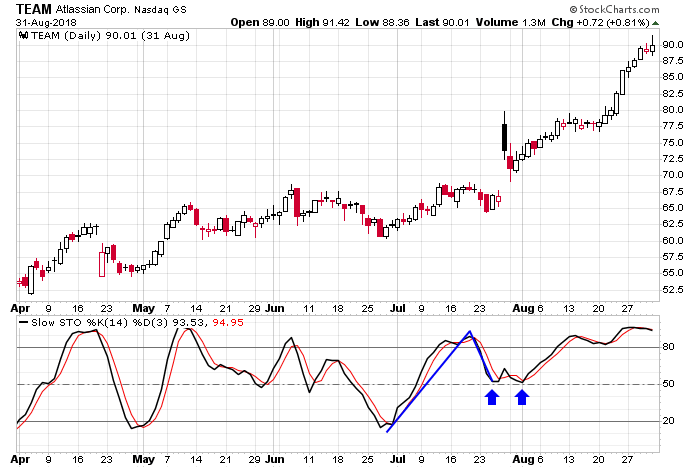
TEAM slowly trended up, and a mini double bounce of the Stochastic on its center line in late July signaled the bulls were getting a little more aggressive. An inflection point was hit soon after, and the uptrend resumed at an accelerated pace.
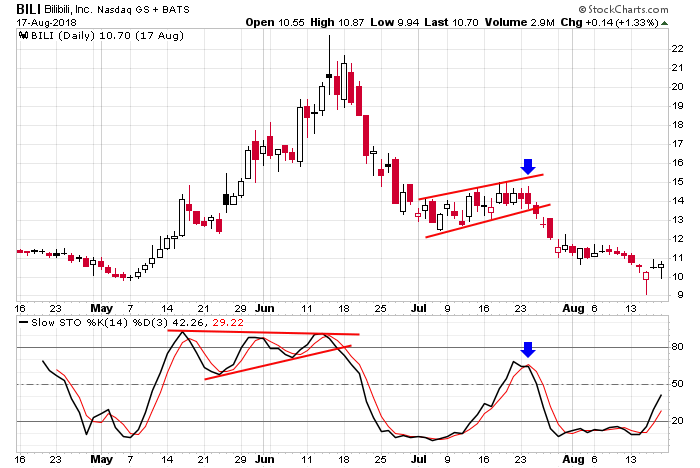
BILI broke down in June and then formed a bearish flag pattern in July. During this time, the Stochastic cycled up and then rolled over. It got passed its center line but couldn’t make it to overbought territory. It didn’t matter. Once the indicator rolled over, the stock’s newly formed downtrend resumed.
Positive/Negative Divergences
Positive and negative divergences form when the price of the underlying entity moves to a lower low or higher high and the Stochastic fails to confirm the move by printing a higher low or lower high. Regarding a negative divergence, we’re told the underlying was unable to close as high within its range as it had previously done, and with a positive divergence, we’re told price closed further off its low, within the look-back range.
Before moving on to some examples, it’s important to note that with a bound indicator, where there’s a min and max value, positive and negative divergences will form as mathematical phenomenons. They should not be trusted at face value, especially within a trend. In fact it would be impossible for them to not eventually form, so look for secondary confirmations, such as the indicator crossing out of overbought or oversold territory, crossing its signal line, crossing its center line or with a trendline break of the underlying security.
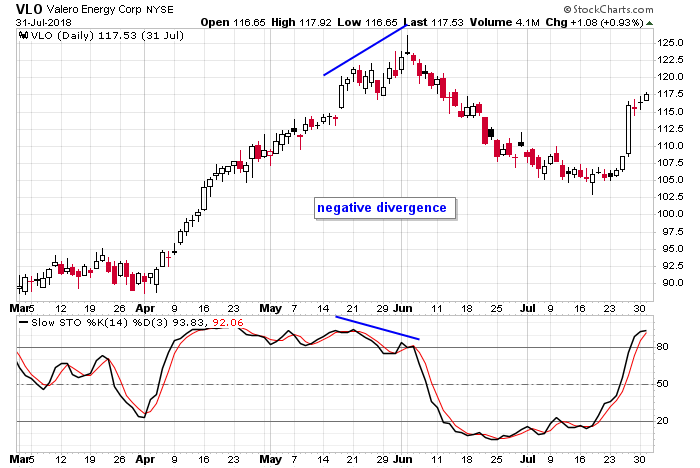
VLO steadily trended up for two months and then rolled over. During this time the Stochastic got into overbought territory and held the reading for about 6 weeks. Given the stock’s strength, despite the negative divergence, a sell signal isn’t given until the indicator moved below 80 and then took out that level (late May) a week later. The negative divergence told traders the stock might be reversing, but it wasn’t until we got confirmation later that a signal to sell a position was offered.
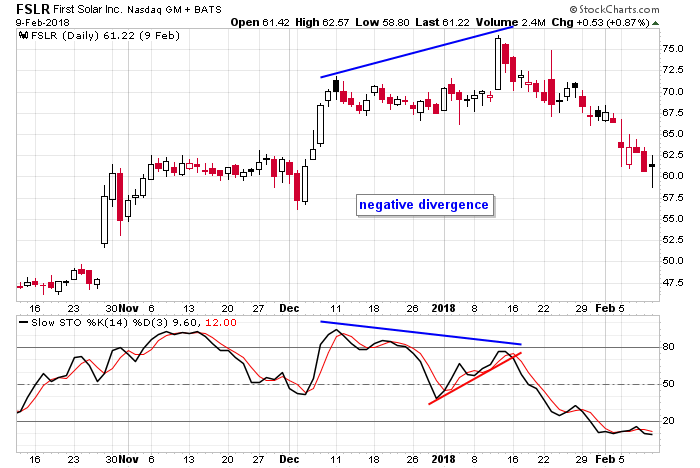
FSLR was moving up, but it wasn’t an incredibly strong stock. The higher high in January coincided with a lower high by the Stochastic, and after the indicator broke a support level (shown in red), the stock rolled over and gave back a chunk of its gains.
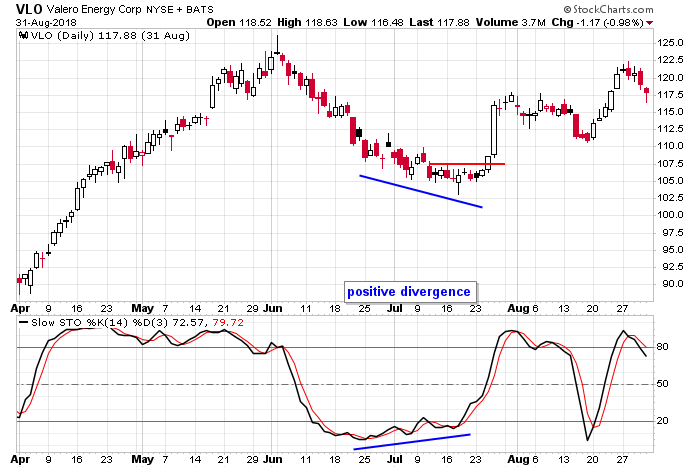
VLO was a strong stock in an uptrend that was in the midst of a temporary pullback when it formed a positive divergence with its Stochastic. As the stock grinded lower in July, the indicator slowly trended up. With the %K line above its %D line and above 20, a buy was signaled when the stock broke out at 107.5.
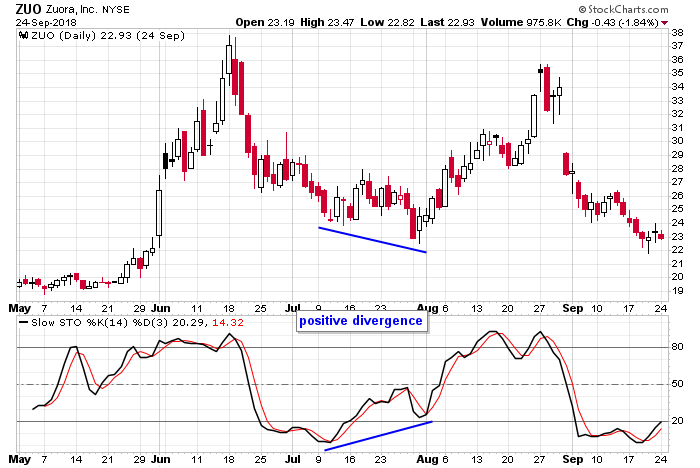
ZUO doubled over a 4-week period from mid-May to mid-June and then gave back a chunk of the gains in June and July. A lower low from the stock along with a higher low from the Stochastic tipped to odds of a reversal in favor of the bulls in late-July. Once the indicator got above its previous high and its center line at 50, the stock was free to rally up again.
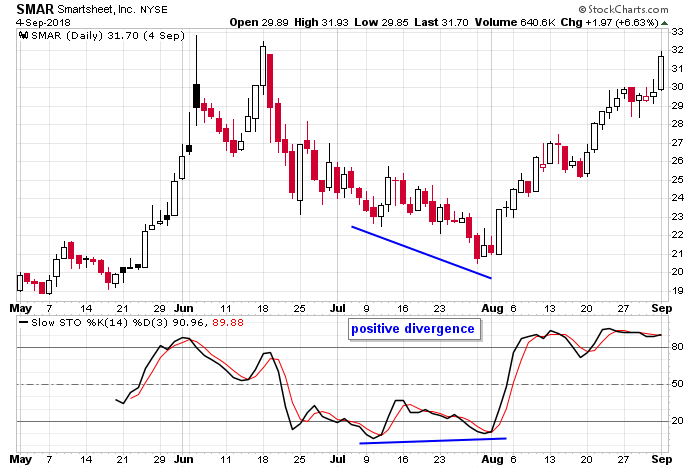
SMAR grinded down during July and formed a positive divergence with it Stochastic, which couldn’t take out its previous low. As a bound indicator, the Stochastic can only fall so far, regardless of how weak a stock is. Because of this, look for confirmation elsewhere. Wait for the %K line to cross the %D line or for it to cross back above 20. In this case, the stock based for 3 days and then jumped 10%.
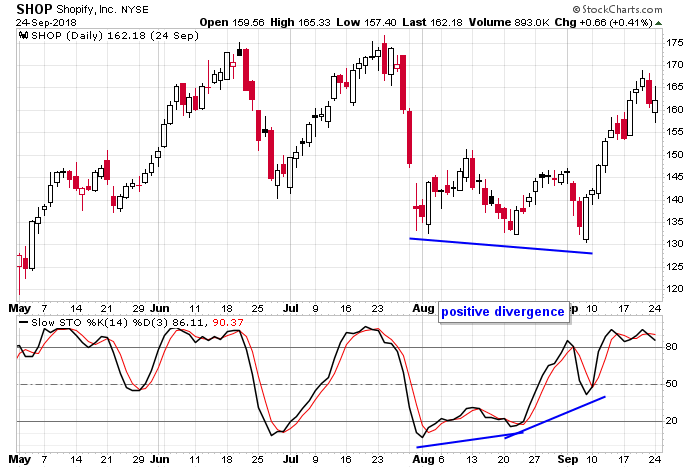
SHOP put in a mini triple bottom with the second and third low being lower than the previous lows. The Stochastic put in higher lows and a very obvious positive divergence in September. The ability of the indicator to resist falling much on the third dip was a sign of strength, and the stock surged soon after.
Bull/Bear Setups
Bull and bear setups are the inverse of positive and negative divergences. Instead of price moving to an extreme (higher high or lower low) and the Stochastic failing to match the movement, the opposite occurs. The indicator moves to a higher high or lower low while the underlying security does not.
For example, when a stock puts in a lower high but the Stochastic moves to a higher high, traders are told positive momentum is building. This is not a signal, just a hint that the next price drop is likely to be buyable.
Likewise, when a stock puts in a higher low but the Stochastic drops to a lower low, traders are told downside momentum is strong or building, and whatever bounce takes place next is likely to get sold into.
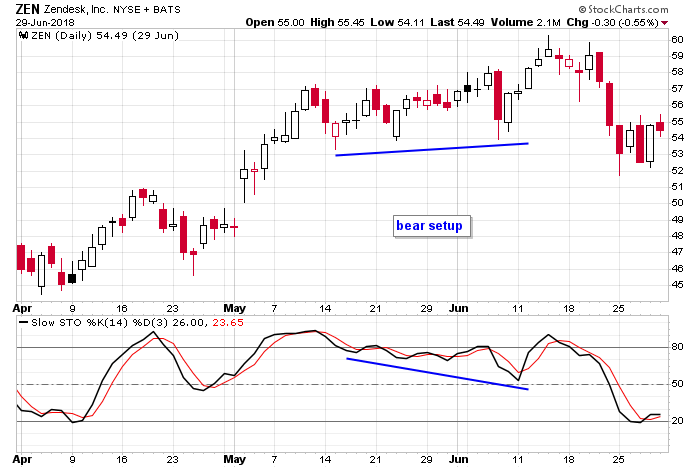
ZEN put in successive higher lows while its Stochastic trended down and put in lower lows. This was a sign that despite the stock’s uptrend, the upside was likely limited, so traders should be more careful initiating new positions where a tight stop is not able to be used. It turns out the next pop only went a couple points before getting sold into.
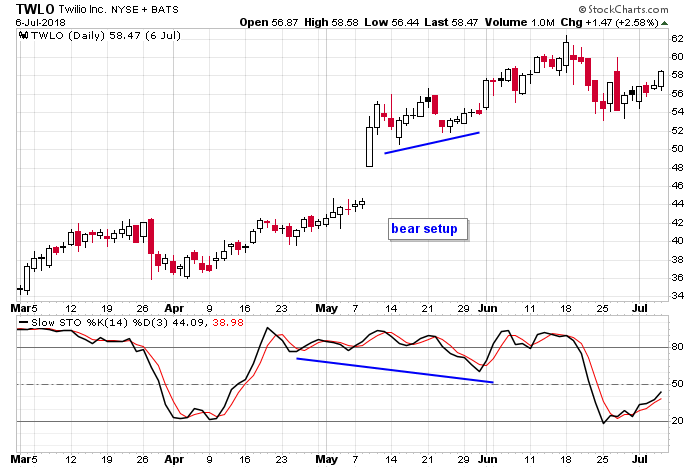
TWLO gapped up and pushed higher while its Stochastic fell out of overbought territory and took out its lows of the previous month. This was a sign the stock’s strength wasn’t entirely supported. ZEN did push higher but eventually came back down to where it was when the divergence formed. Being aware the stock wasn’t likely to go far without coming back down and letting the Stochastic cycle down can help a trader with entries and management.
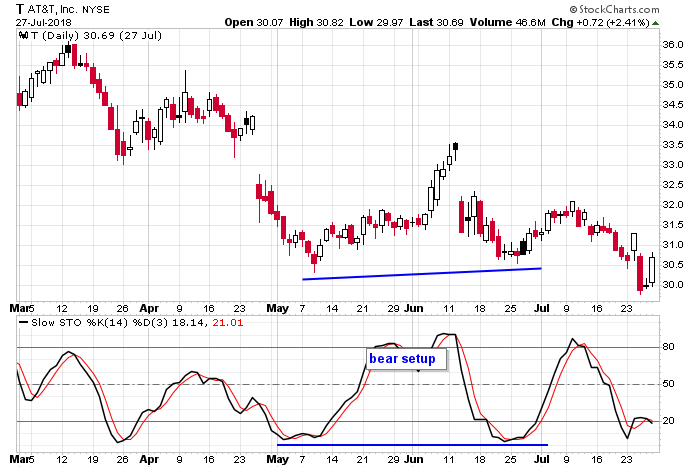
AT&T was trending down when it put in a higher low, but its Stochastic matched a previous low. This told traders the stock wasn’t quite ready to put in a bottom and rally. A bounce followed, but it didn’t go far or last long before the stock rolled over and dropped to take out its low.
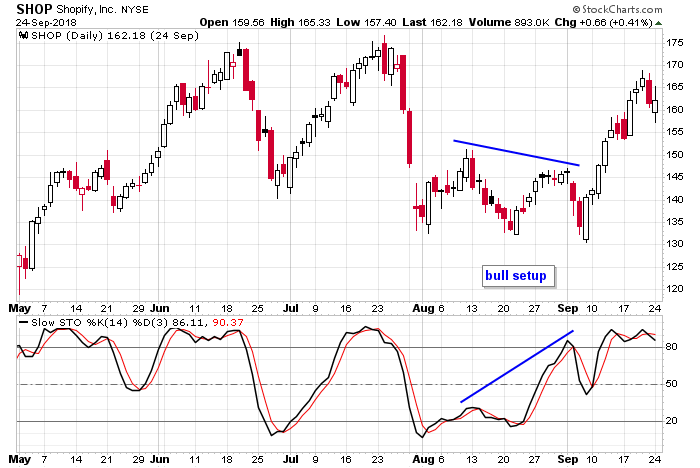
In late-August of the SHOP chart shown, the stock put in a lower low, but the Stochastic registered an obvious higher low and got all the way to overbought territory. This was a sign that despite the stock struggling a little, strength was building. It told us weakness from there was likely to get bought up. The next dip was relatively brief, and the stock surged off its low.
This write-up is a work in progress. More examples will be posted. Join our email list. Be alerted of new content.
2 thoughts on “Stochastic – Everything You Need to Know”
Leave a Reply
You must be logged in to post a comment.
Very good lesson. Thanks.
Thanks for sharing as always, Jason! Please keep it up!