The market tanked again last week. Like the previous week, there was an attempt to rally off oversold levels, but the attempt was quickly squashed. The selling we’ve gotten is much worse than anything we’ve seen in several years – much worse than February. In fact this is the single worst month following an all-time high in history. Yes, history. The market has never hit an all-time high and then fallen this much the following month. Nobody knew it would get this bad this quickly, but we definitely knew weakness was in the pipeline.
—————
Not a Leavitt Brothers subscriber but appreciate our work? Consider making a small donation.
—————
The lack of quality setups has been an issue since early September. The market was hitting new highs, yet scanning 1000 charts revealed very few charts that fit into the “easy and obvious” category.
The small caps were lagging while the large caps were pulling the indexes up. The small caps, to some degree, serve as a barometer of traders’ appetite for risk. This type of divergence is meaningless when it forms for short periods from time to time, but eventually it becomes an issue, as it did.
Breadth was deteriorating. The AD lines were declining. New highs were severely lacking. The bullish percent charts were weakish. New lows were moving up. On the surface the market seemed to be in good shape, but beneath there were obvious warnings. If the S&P is hitting a new high, but there number of individual stocks hitting new highs is trending down, there’s a problem.
Did I know the worst month following an all-time high would be recorded? No way. We never know what’s going to happen. But we can listen to the warnings, and at the very least protect what we have.
I’ve made it very clear the last couple weeks this was going to be the wild, wild west. Big up days would be followed by big down days. And vice versa. And sometimes big ups would be followed by big downs in the same day. What used to take a week or longer to play out would take place in a day.
Any position held can go from being a big winner to a big loser very quickly. Or vice versa. One day you think you’re a genius; the next day you feel like a complete idiot.
We’ve had several days where strong closes were followed by a big gap down or weak closes were followed by a big gap up. The trend is down, so anyone who’s simply gone short and held has done very well. But anyone who has tried to navigate the day-to-day movement has been up against the trading challenge of their life.
This is the state of things. I’ve very clearly given a heads up that the market had changed and things would be different. I knew how they’d be different, but I couldn’t tell anyone what would take place day-to-day.
For some this market is a dream. After such a long period of low volatility, to finally get lots of intraday movement is like sitting down at an all-you-can-eat buffet at your favorite restaurant. For others, it’s very difficult to deal with. The back and forth movement. The lack of staying power. The inability to sustain anything. The big gap opens. The totally unpredictable earnings reactions. It adds up to hell if you desire a calm and smooth market. But in the same way a surfer can’t control the waves, you can’t control the market. You either recognize and embrace the opportunities or you stay on the beach and wait for a situation that suits you.
Because this has not been a normal, garden-variety correction, other factors are going to come into play that haven’t been issues for years. Margin calls are going out, so there will be forced selling. And investors will have to sell some winners to pay for their losers, so even strong stocks will be prone to selling pressure. Perhaps this is why the market hasn’t been able to bounce. Many indicators got oversold two weeks ago, yet only a couple single-day bounces have materialized.
When the market can’t bounce when it should easily be able to, there’s a problem. Something else is in play.
When a spike in new lows can’t produce a bounce…or a flush out of the AD line…or a plunge in the number of stocks above certain moving averages…when any number of extreme breadth prints can’t entice buyers to step up, we know things have changed. We know this is not just a normal “pullback within an uptrend.”
Tops take time to form. The selling in February and the high-volatility swings that followed comprise warning shot #1. The current plunge is warning #2. A top is being formed. Even if the market rights itself and moves back to its high and the S&P rallies to 3000 or beyond, we’ll look back a year from now see these two periods as early-warning signs.
Despite the selling, the bulls have a few things to cling to.
The best month of the year is Oct 27 – Nov 27. This period starts now.
The ability of the market to post a 3% year-to-date gain in May…and to post a gain through July…and to hit a new high in August and September…and a strong Q3…and other quant studies all favor a strong finish to the year.
And the period after midterm elections has historically been very strong.
These stats are a double-edged sword. Many bulls have hunkered down and held positions, trying to ride this correction out, assuming history will repeat and save their asses. But what if it doesn’t? At what point will the market push through a threshold and cause enough pain for the bulls to throw in the towel, even though they want to cling to the historical precedent? I don’t know the answer, but it’s the type of thing that’s on my mind. As bad as the selling has been, it could get worse. Each individual investor has his own pain threshold, and as the market drops, one by one, these investors sell off some positions, which of course adds to the downside pressure.
There have been a couple attempts to rally the market the last two weeks. So far nothing has stuck. Eventually a big rally will be followed by a gap up and a continuation. Be ready. Be mentally ready for big moves in both directions. And when a rally actually gets going, it can go further and last longer than you expect. Lots of traders are looking for a chance to short a rally. If the market Gods operate to piss off the most number of people, a bounce will go far enough to stop shorts out a few times. And then when the shorts give up, the market will roll over. This will not be easy.
If you’re a highly skilled short term trader, take advantage of the opportunities. If not, I highly recommend you not get in over your head.
Let’s get to the charts and see what they say.
Indexes
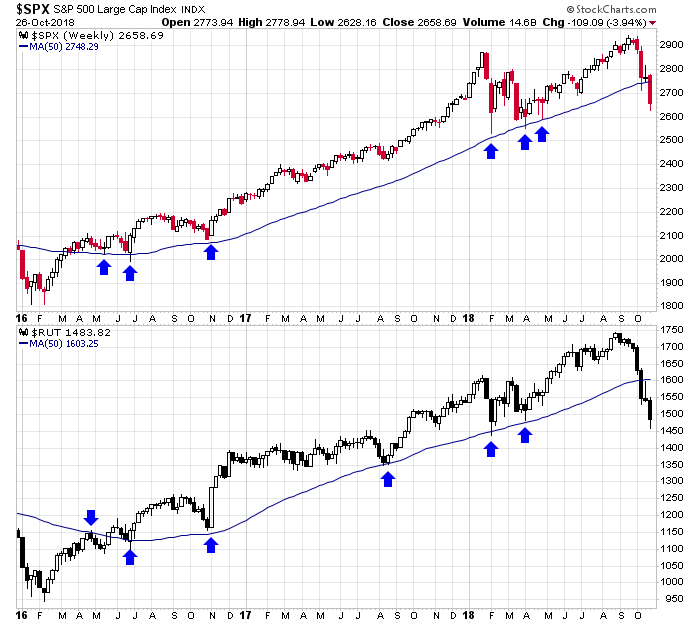
The S&P 500 & Russell 2000 Weeklies: Three weeks ago the Russell sliced through its 50-week MA. This past week the S&P did the same. There’s nothing bullish about this. There’s nothing for a long-time bull to cling to. This is significant, and with rates moving up and bonds paying higher yields, there could be a shift at the institutional level to rotate funds out of stocks.
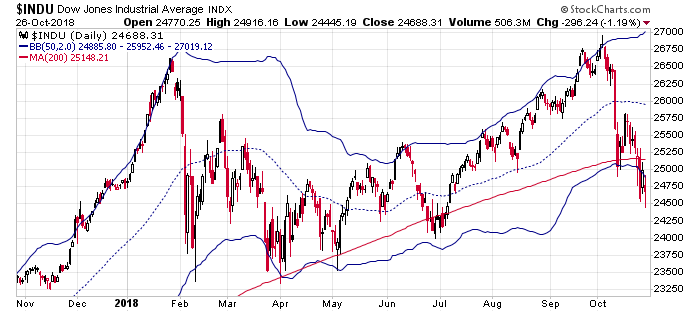
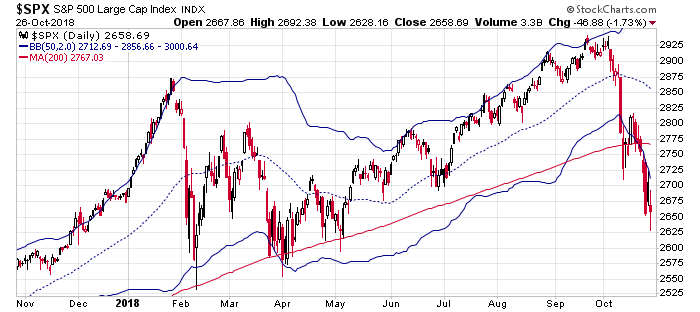
The Dow and S&P 500 Dailies: These are 1-year Dow and S&P charts. I use them instead of longer term charts because they give a better visual of what’s taken place in the last year as opposed to the last couple years. You could argue that despite the all-time highs, the market has been mostly range bound. Nearer term, the 200’s have been taken out. So have lower bands of the 50-anchored Bollinger Bands. The 200’s are an issue – they’ll be resistance on the way up. So will the 50. It’ll take time and a couple attempts to peck away at the upside and clear the way for a sustained move…if a sustained move is in the cards.
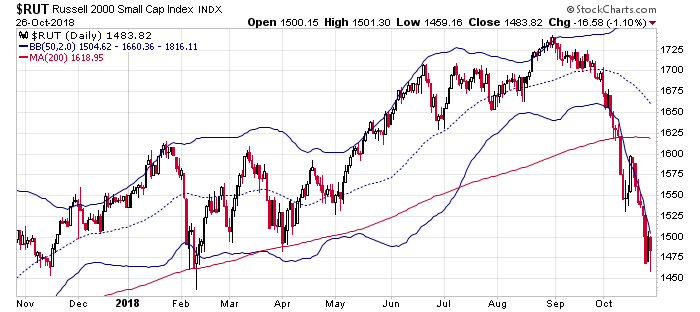
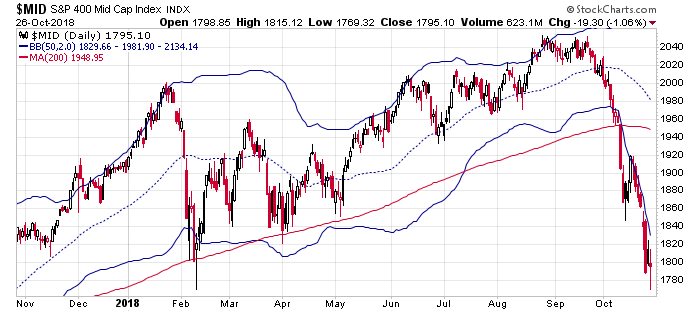
Russell 2000 and S&P 400 Dailies: Both the RUT and MID are down over the last 12 months. This is not how healthy markets behave. Dips within uptrends? Yep. Occasional bigger pullbacks? Sure. But slicing through long term moving averages and dropping to 52-week lows? No way. Lots of damage has been done, and it’ll take time for the market repair itself.
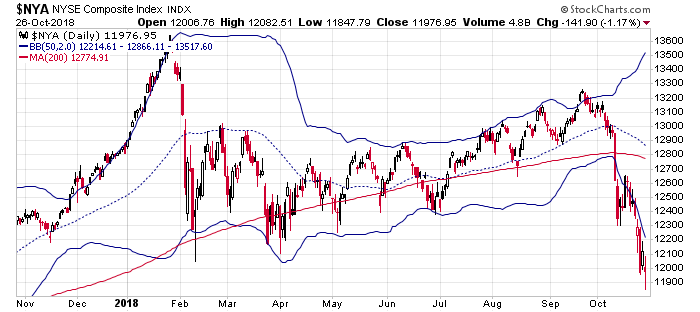
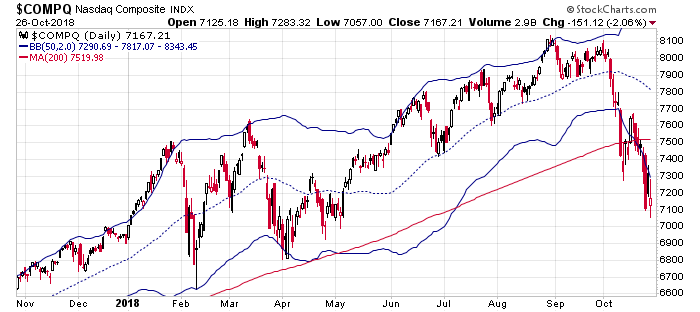
NYSE and Nasdaq Dailies: If you argued the Nas was trading in an up-trending channel, you have to go back to the drawing board and find something else to cling to. The channel has broken down. The NYSE, which has a lot more foreign exposure, is at a 52-week low.
Indicators
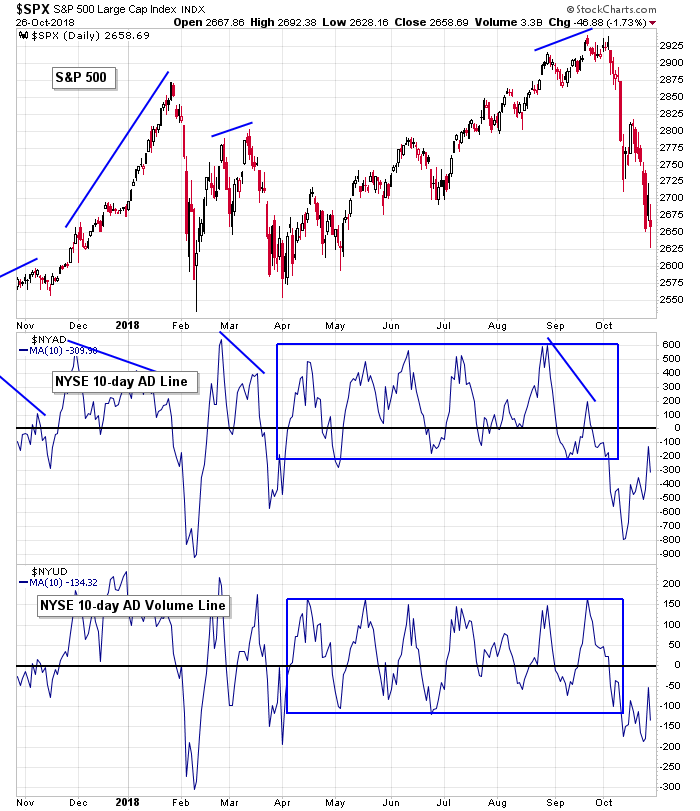
S&P 500 vs. 10-day MA of NYSE AD Line & 10-day MA of NYSE AD Volume Line: Over the last 10 days, decliners have out-numbered advancers, but by a much smaller margin than on the first leg down. It’s something for the bulls to cling to. The AD volume line has not put in the same positive divergence, but it didn’t fall much either. It’s back at a level that wasn’t considered overly bad just a few months ago. It simply suggests down volume has out-paced up volume by a moderate and not-so-scary amount. I see improvement here, but it must continue. The bulls need these curves to get back above 0, like the second half of February.
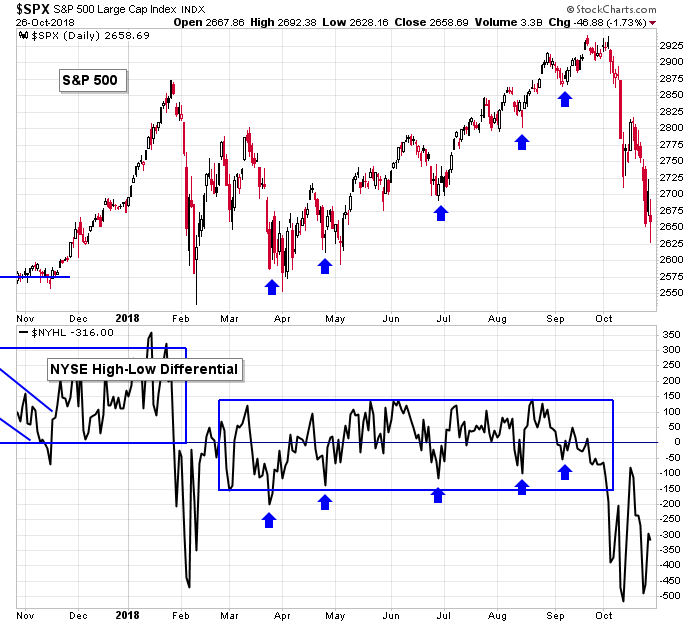
S&P 500 vs. NYSE Cumulative AD Line & NYSE Cumulative AD Volume Line: The AD and AD volume lines have dropped further below their 50-day MAs in at least a year. They will now be resistance on the way up. In the same way it took a couple months last spring to base before the market could rally again, the same movement will be needed now. Advancers will need to consistently beat decliners for long enough to give investors confidence to come back to the market. This will take time. Odds do not favor a quick recovery this holiday season. Time will be needed for the psychological wounds to heal.
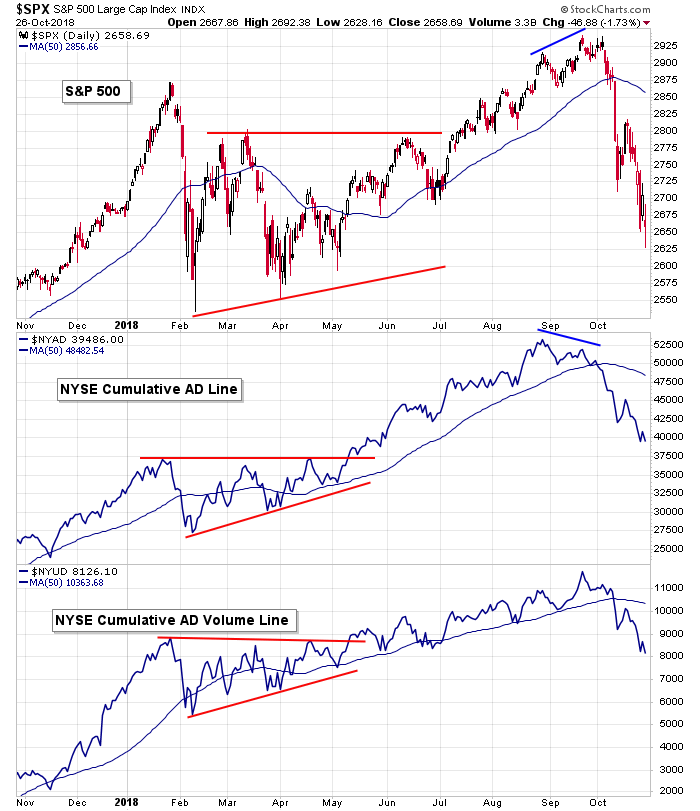
S&P 500 vs. NYSE New Highs & NYSE New Lows: New lows at the NYSE have spiked again – the third straight week. How many times does capitulation have to take place before a local bottom can be established? The selling has been consistent enough and intense enough to set the stage for a rally, but buyers need to step in and do their thing. New highs are of no help right now. It’s not until the market moves up that we’ll look for confirmation from the new highs a week or two later.
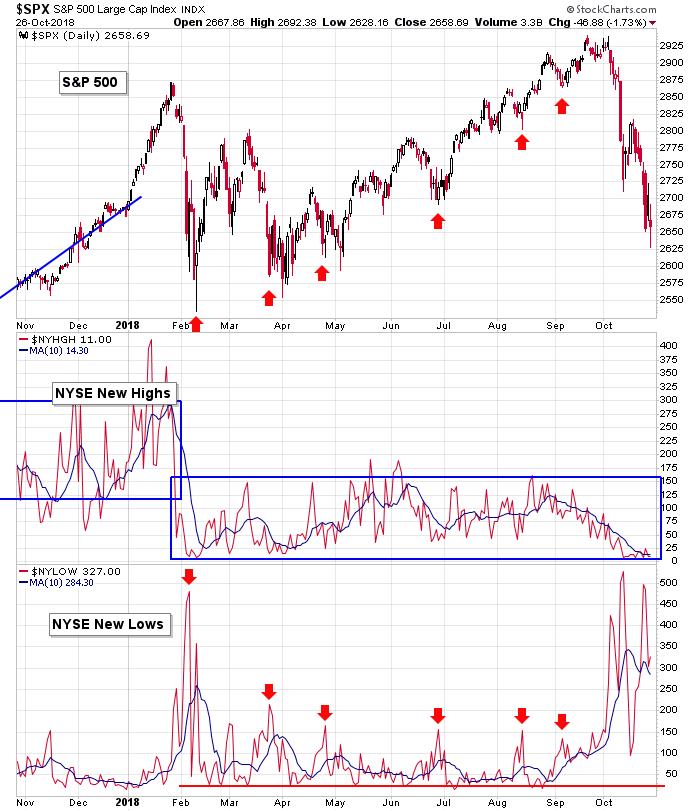
S&P 500 vs. NYSE New Highs (weekly): Even if the market rights itself and moves up – even moves up to its high – the lack of new highs on the weekly time frame will be a major hurdle to overcome. Unless new highs quickly expand like they did off the early-2016 bottom, a rally attempt will be temporary.
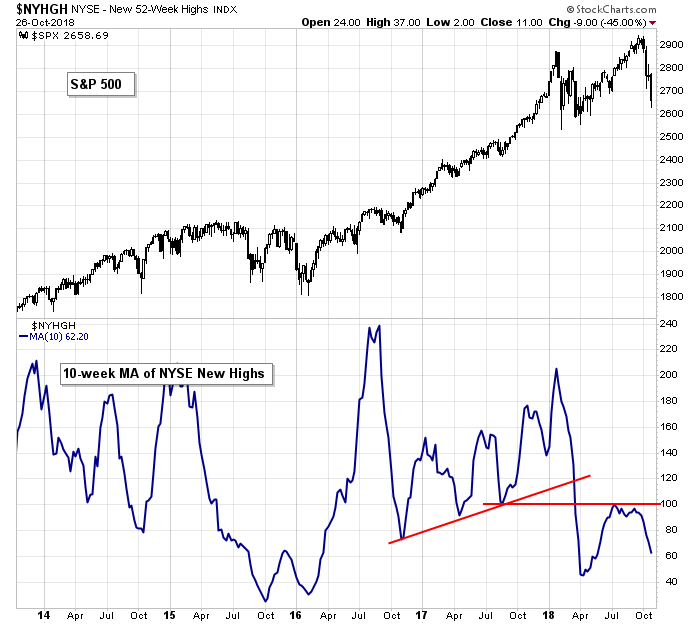
S&P 500 vs. NYSE High-Low Differential: The high-low differential this past month has acted like it did the first two weeks of February. Back then the indicator recovered and straddled the 0 line. At the very least, the same will be needed now for a rally attempt to have legs. Absent this, a bounce will get sold into, and there’ll at least be a double bottom.
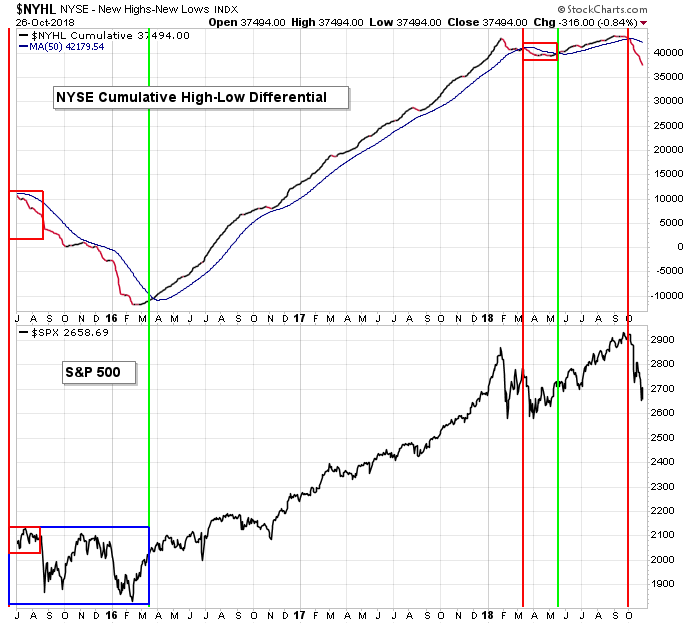
S&P 500 vs. Cumulative High-Low Differential: The cumulative high-low differential looks more like the middle of 2015, when the indicator separated itself from its 50, than earlier this year, when it simply flattened out. It does not bode well going forward. Damage has been done, and it’ll take more than a simple bounce to fix.
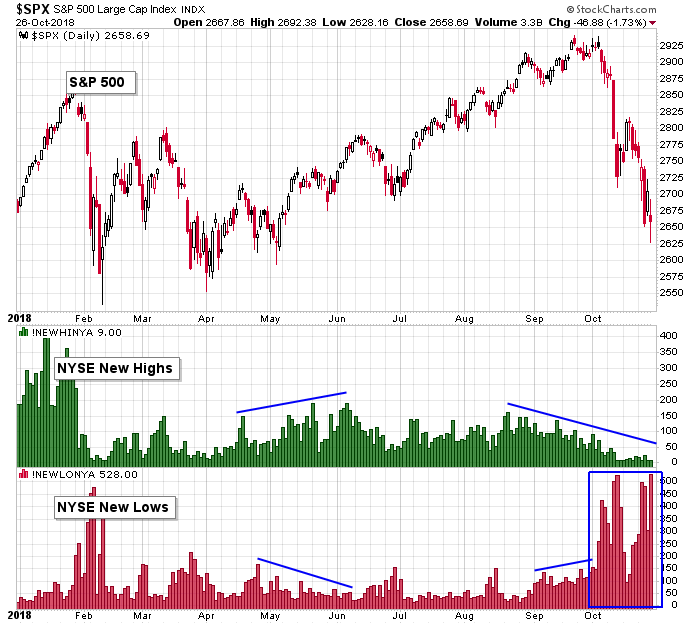
S&P 500 vs. NYSE New Highs and NYSE New Lows: New highs are low; new lows are high. No surprise. But look at the late-February and early-March activity – new highs didn’t completely recovery, but they did trend up for a few weeks while new lows mostly fell back to their lows. It took two more stabs down to finally form a bottom, but the hints were there. The bulls will want to see the same now. If/when the market bounces, will we get a little pop in new highs, and will new lows fall back to their lows? The answer will tell us what’s brewing…if there’s still some underlying strength…or if it’ll take much longer for the market to heal.
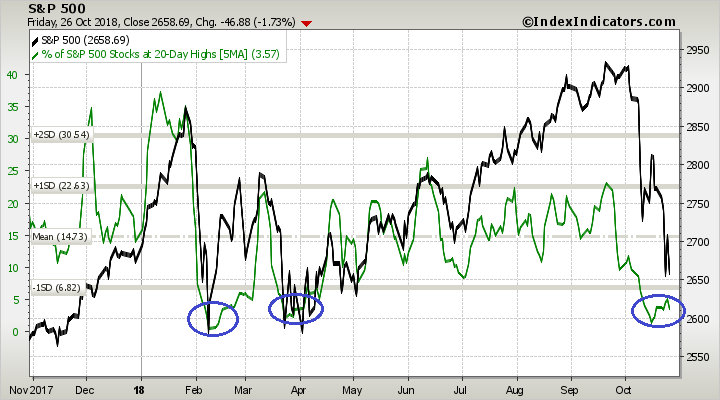
S&P 500 vs. Percentage of SPX Stocks at a 20-day High: The percentage of SPX stocks at a 20-day high curled up last week, so despite the big red weekly candle that formed, a little strength it building.
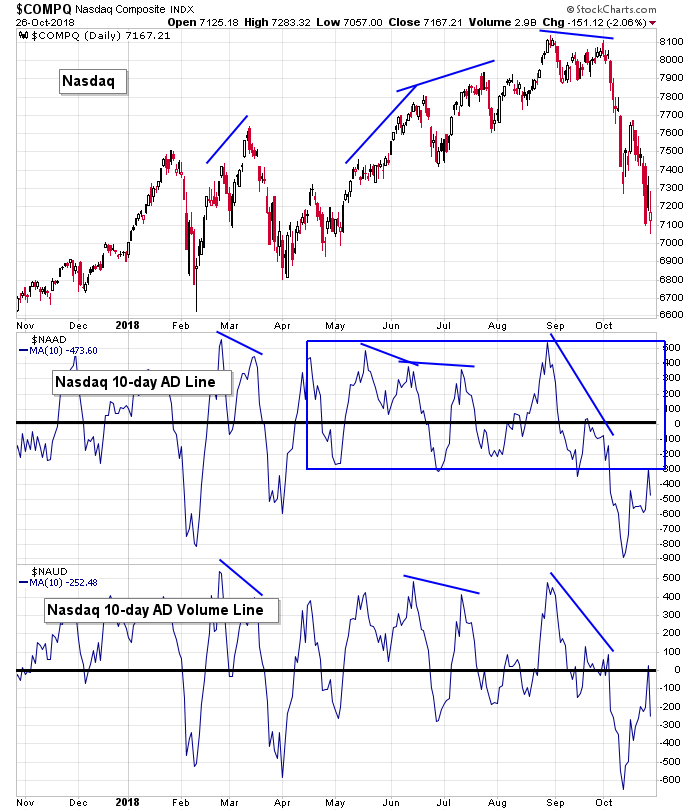
Nasdaq vs. 10-day MA of Nas AD Line & 10-day MA of Nas AD Volume Line: The 10-day of the Nas AD volume line moved back to 0 before dropping back. The fact that it could accomplish this is noteworthy. The AD line got rejected by the bottom of the box that supported the indicator during the summer strength. The bulls want the AD to act like late-February, when it easily climbed above 0. It’s not happening yet.
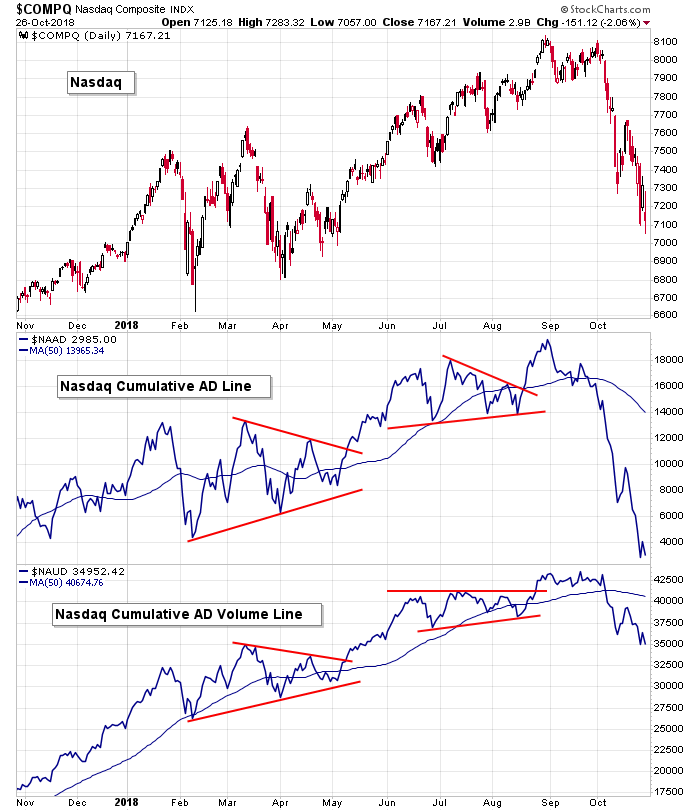
Nasdaq vs. Nas Cumulative AD Line & Nas Cumulative AD Volume Line: The Nas AD line has dropped to a new 52-week low while the Nas itself is still up 10% over the same time period. This is what bad breadth looks like. On the surface the index has done well on a year-over-year basis, but over the same time period there have been more decliners than advancers. This indicator has always had a downward bias to it because there are a lot of crappy stocks that trade at the Nas that don’t deserve to be pubic companies. Still, this extreme of a drop in such a short period of time is not just bottom of the barrel stocks, it’s everything.
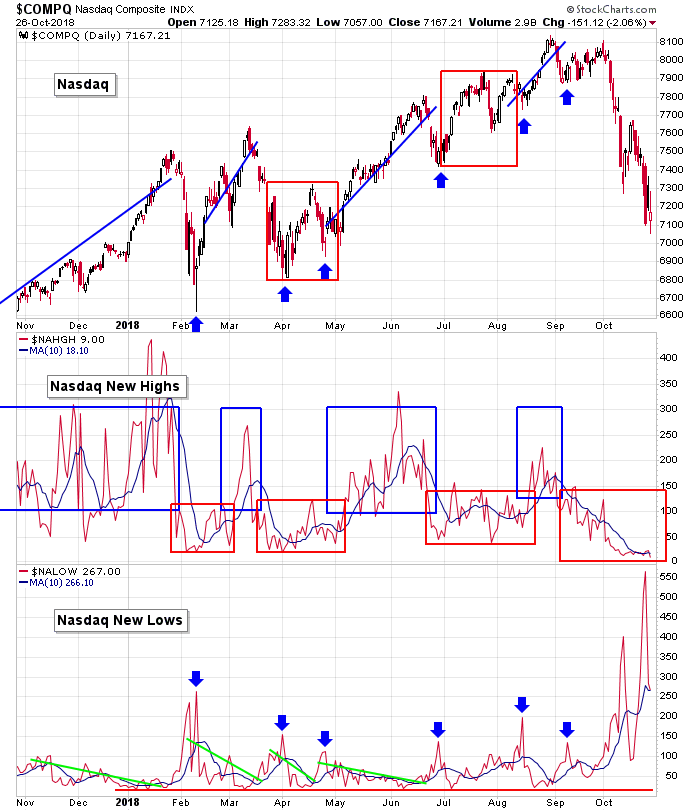
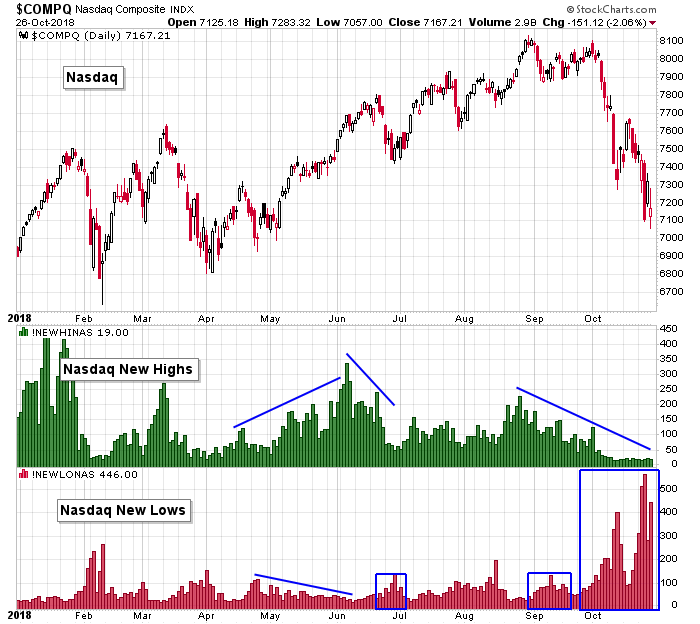
Nasdaq vs. Nasdaq New Highs & Nasdaq New Lows: This is the biggest spike in new lows since early-2016. The stage is set for a bounce, but market psychology has taken such a big hit. A bounce is easy (the first couple days), but for it to last, something will need to change about attitudes towards stocks.
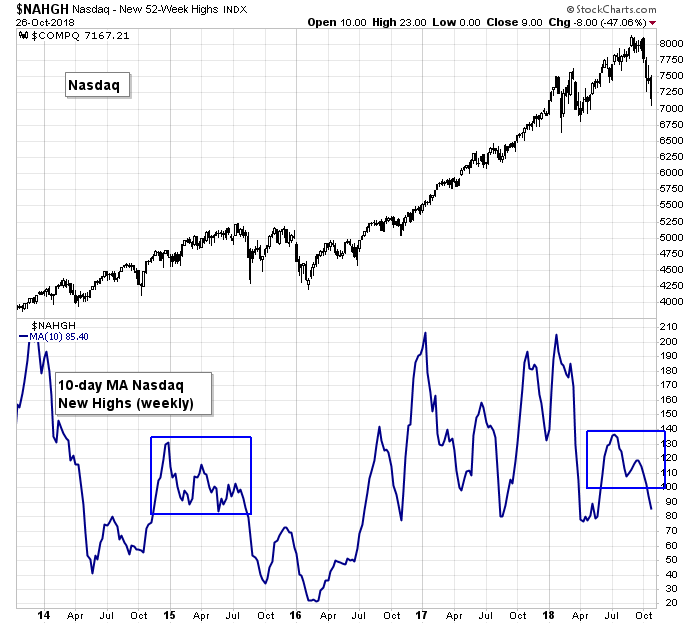
Nasdaq vs. Nasdaq New Highs (weekly): The lack of weekly new highs is a major issue. Even with the index hitting multiple all-time highs the last couple months, new highs on the weekly time frame have been severely lacking. If the market bounces, this is going to act as a drag and will eventually pull everything down again.
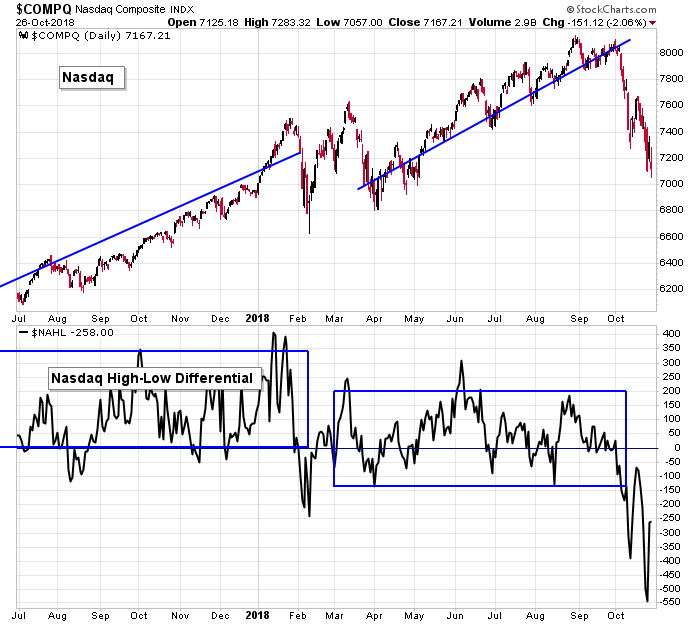
Nasdaq vs. Nasdaq High-Low Differential: The high-low differential hasn’t dropped like this since early-2016. Those steady fluctuations above and below 0 (instead of mostly above 0) have warned us for months the uptrend didn’t have full support. Now the gains have been given back – we’re not much better off today than the beginning of the year. For any bounce to have legs or last, steady prints near 0 are needed.
Nasdaq vs. Cumulative High-Low Differential: For the first time since mid-2015 the cumulative high-low dropped below its 50. But unfortunately for the bulls, the indicator is distancing itself from the moving average, which means it’ll take much more time to recover…which means a recovery is more likely to fail, leading to at least a double bottom.
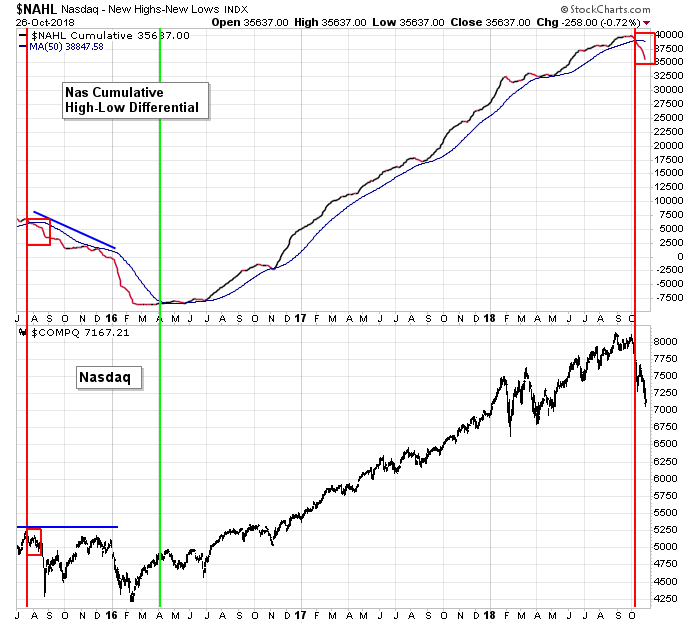
Nasdaq vs. Nasdaq New Highs and NYSE New Lows: A different look at new highs and new lows. For a bounce to last, new lows must immediately drop under 100…and then a week or so later new highs need to start expanding. Elevated new lows during a bounce hints at selling that hasn’t been exhausted yet. Said another way, if capitulation does happen, there shouldn’t be many new lows when the market moves up.
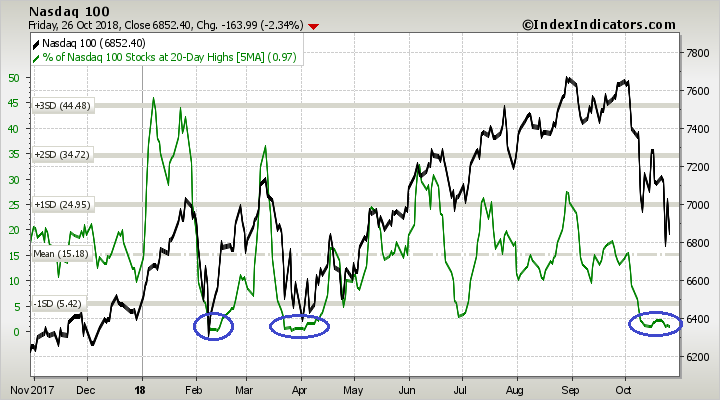
Nasdaq 100 vs. Percentage of NDX Stocks at 20-day High: The percentage of NDX stocks at a 20-day high held steady last week – not bad considering the spanking the market took. Like many other indicators, the stage is set. The market is enough oversold to support a bounce. Buyers just need to step in.
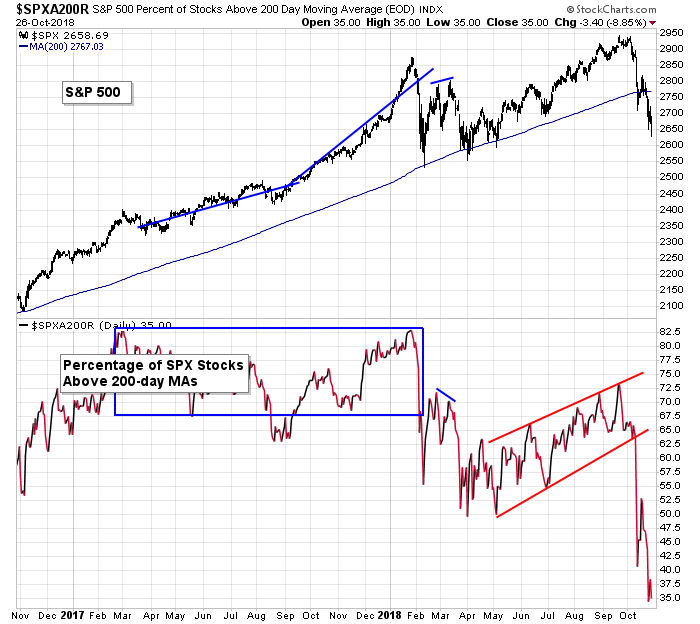
S&P 500 vs. Percentage of SPX Stocks Above 200-day MA: The percentage of SPX stocks above their 200-day moving averages has dropped to its lowest level since early 2016, but back then a bottom wasn’t formed until the indicator dropped to 20. It may take another stiff plunge lower for that to happen.
S&P 500 vs. Percentage of SPX Stocks Above 50-day MA: Potential double bottom for the number of SPX stocks above their 50’s. The market is in bad shape – bad enough to suggest enough selling has taken place to for a local bottom to form. But bottoms are a 2-step process. 1) Intense, capitulatory selling, and 2) Lots of buying. I think we have #1; now we need #2.
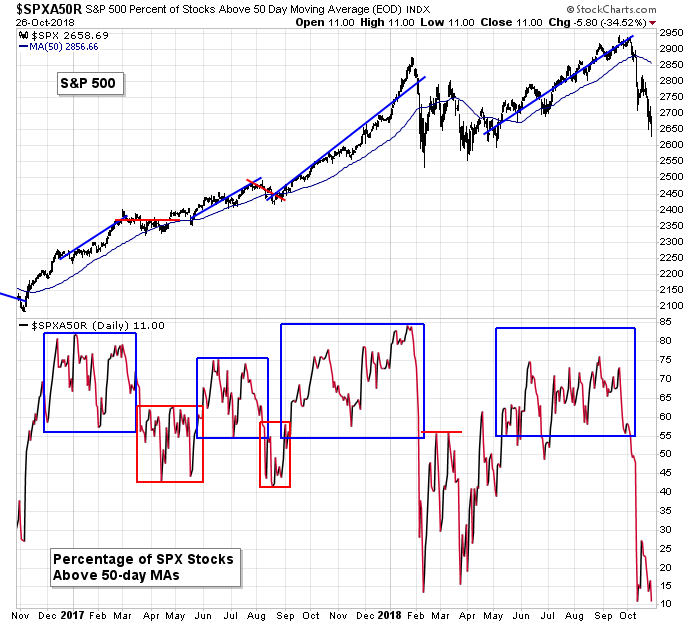
S&P 500 vs. Percentage of SPX Stocks Above 20-day MA: The percentage of SPX stocks above their 20-day EMAs will recover first. If it can hold above 50%, a bottom will be in place. But if this indicator plunges again, like early-March, the market will do the same.
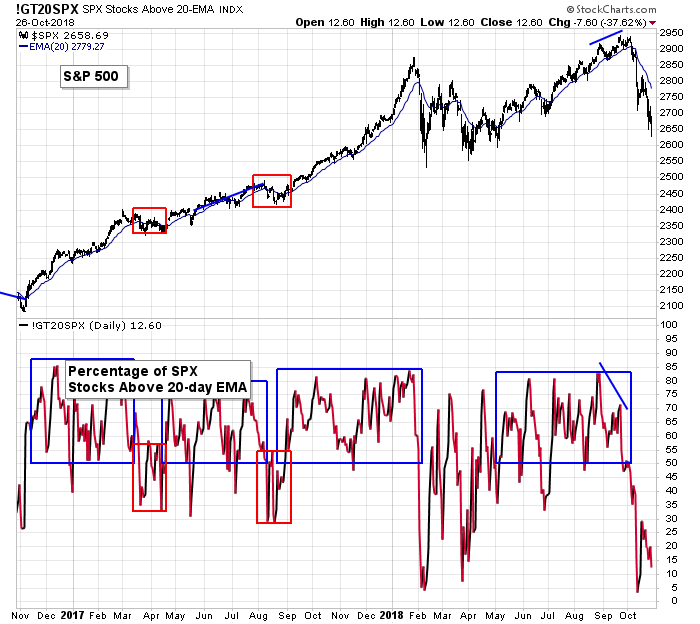
S&P 500 vs. NYSE Bullish Percent: The NYSE bullish percent is heading straight south. It can recover quickly, but double bottoms are more normal. Lots of damage being done.
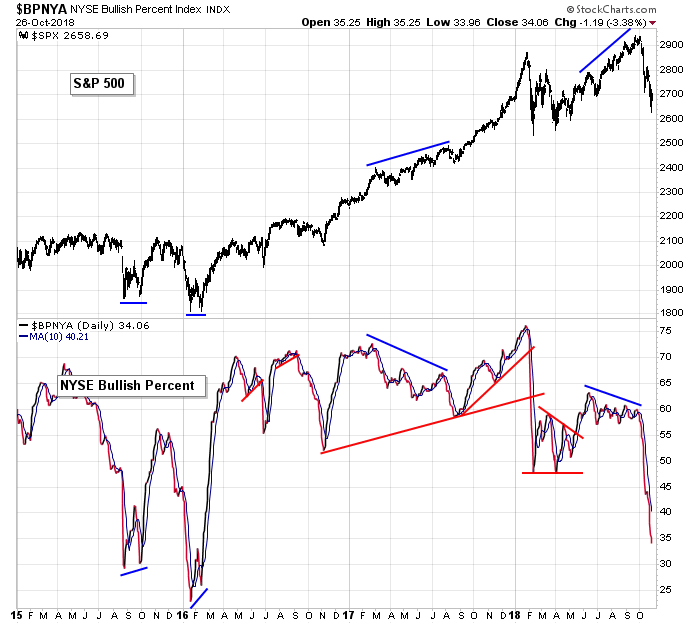
NASDAQ vs. NASDAQ Bullish Percent: The Nas bullish percent plunged after taking out support in the low-50’s, and there are no signs of a reversal in sight.
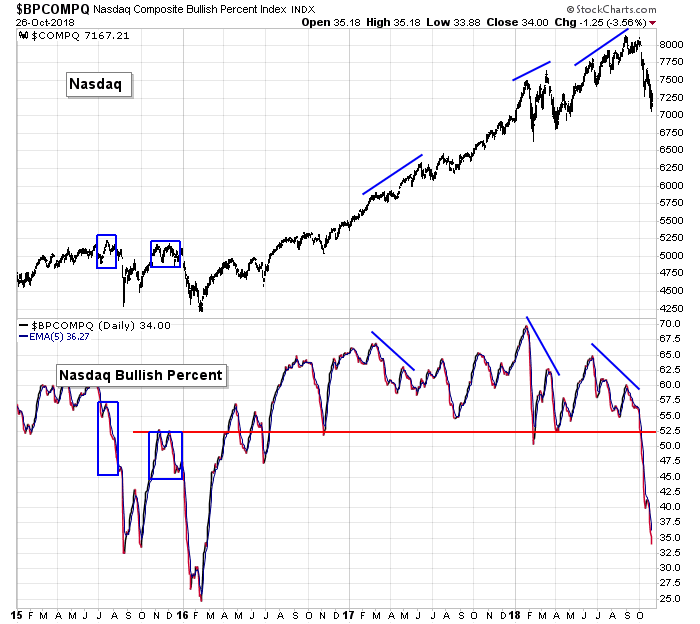
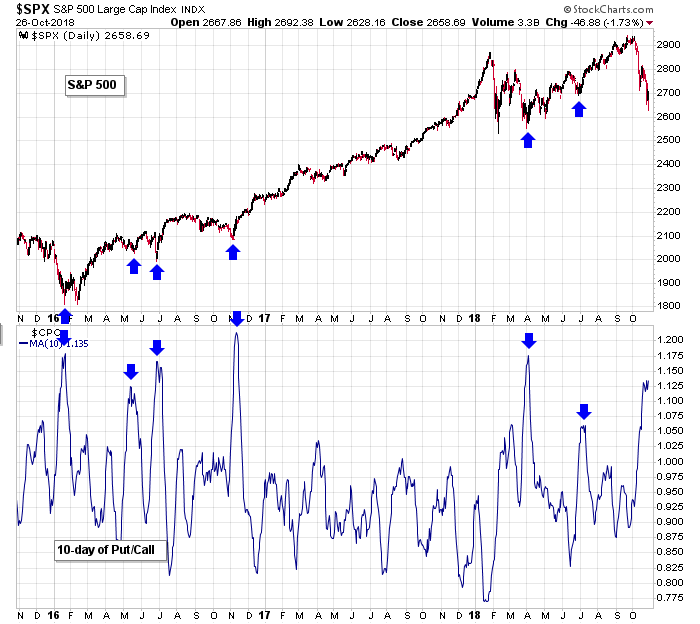
S&P 500 vs. Put/Call Ratio: Last week the put/call ratio spiked and was ready to support a bounce. It didn’t happen, but it’s still sitting up here ready. The market can bounce any time it wants. Many indicators have moved to extreme enough levels. They don’t have to move further.
The Bottom Line
The market is oversold on many levels. Besides many breadth indictors dropping to levels not seen in at least a year, many studies point to consistent selling pressure that as rarely happened. For example, the S&P has posted a loss 20 of the last 26 days. This has only taken place 4 times in the last 20 years – all in October 2000.
The stage is set for a bounce. There have been a couple attempts the last two weeks, but each didn’t last long. Soon a bounce will last. The market is very forgetful. A slight nudge to the upside with a couple decent earnings reports – it wouldn’t take much. Be ready. If you’re short, have stops in place just in case.
The next two weeks will be very important. When/if the market bounces, how far will it go? How much energy will it have? Will market psychology change? Will the indicators improve?
Expect lots of volatility. Lots of intraday movement. Big swings in both directions. If you’re a skill short term trader, fully take advantage of the environment. If not, don’t push it.
I’m looking for a bounce very soon. Then we’ll have to closely gauge whether the move has staying power or a double dip is likely.
Have a great week.
Jason Leavitt
One thought on “LB Weekly (Oct 28)”
Leave a Reply
You must be logged in to post a comment.
Kind of reminds me of the month plus before 911. My guess is that the market now fears the election results.