There’s a sequence on consecutive time frames I watch for with the Stochastic. I talk about it in my masterclass.
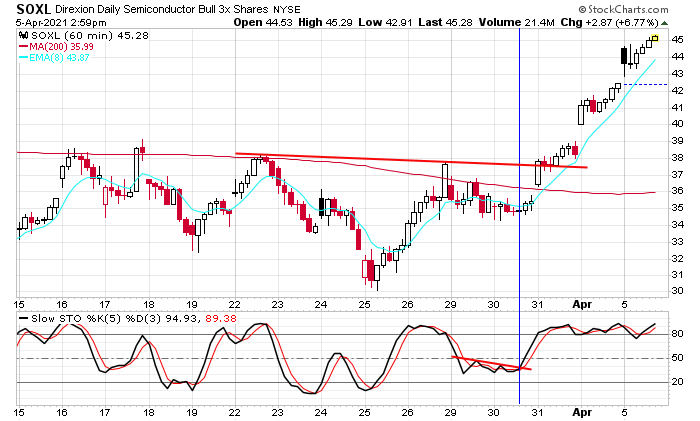
On the hourly chart, the Stochastic broke out – yes, trendline breaks are meaningful. This took place while SOXL was trading in a base.

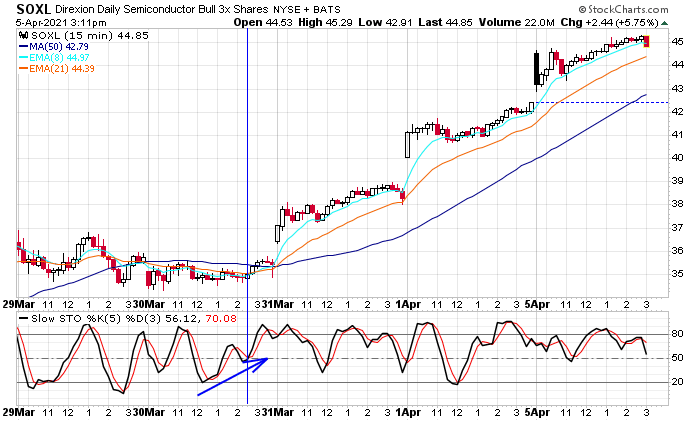
While the hourly buy signal was “on” we can zoom in with a shorter time frame to time an entry. The Stochastic on the 15-min chart, which had already bottomed, briefly dipped and then reversed back up. That was an entry. The stock gapped up the next day and is still going strong.

The sequence of getting a bias from a longer time frame chart and then zooming in and timing an entry with a shorter time frame chart is something I talk about a lot in my masterclass.
Good luck. Join our email list and get write-ups like this sent directly to you.
Jason Leavitt
Im a great fan of your work sir. I study the Stan Weinstein and the Wyckoff method. Over the years I have read up on W.D. Gann, Jesse Livermore, etc. I think I am really ready to just narrow it down to something that works. I have had a minor bit of success following Weinstein method and I also learned something called #TheStrat. I have taken your minor master class for free and I love what you share. I’d be honored to have you as a mentor and prayerfully get to a point of where I can divorce corporate america. At any rate thanks for all you share and if your Real Masters Course is anything greater than the free one on Udemy, then please permit me to sign up. Make it a great day.
Kind Regards,
Donnie
Thanks Donnie. Good news: my full masterclass is available at the following link. If you benefited from the free class, the full class is perfect for you.
https://jason-leavitt-masterclass-in-trading.teachable.com/p/jason-leavitt-s-masterclass-in-trading
I don’t mentor traders one-on-one, but here at Leavitt Brothers, we have a message board which I’m on throughout the day, along with many great traders. I guess you can consider it group mentoring. Ask any question and often get multiple answers from different perspectives.
Good luck – Jason
cherry picking stochastic moves is not trading.
you don’t know when stochastic is going to go your way. you would have tried many times before you got it right. truth is stochastic is a looser indicator, it no longer works as a trading mechanism.
@MARLA CHOCO
Every indicator is a loser indicator, because indicators work in certain markets and don’t work in other markets. Just like almost all the trading systems out there.
It’s a tool, not a sure thing, predict the future with 100% accuracy, ~ if you knew anything about trading or anything about life you’d know that nothing is a sure thing.
I find Stochastic quite usefully, especially the way that Jason uses it, it’s just another “elevating factor” along with, overall market conditions, supporting Ma’s, support areas etc.
If it doesn’t work for you then don’t use it. It works great for me as a timing mechanism. I get a bias from a higher time frame chart and then use Stochastic to time entries on shorter time frames. Do what works best for you. There are lots of indicators to pick from.
I also don’t like stochastic as it can be wrong so many times and if you look each time it WAS showing a setup you will almost always be able to see it on the price chart itself from either a trendline break, price basing and then showing a nice bullish reversal candle during a pullback especially in the shorter timeframe area. Along with a few moving averages. So all I prefer is to be able to read price, moving averages, trendlines with at least 3 touches and maybe volume expansion on the breakout.
If that works for you, keep doing it. Stochastic works well for me. It helps me time entries.
Not following it either, the stochastic you are showing seems to flip/flop almost immediately, was that a trigger to sell then?
No it’s not a signal to sell. A bias is derived from a higher time frame chart, in this case the hourly. A lower time frame chart will then oscillate up and down, helping traders time entries. Notice how the stochastic stays elevated on the hourly chart. That means the long signal is still on.
Big fan od stochastic and use it daily as one tool to help determine if I buy a particular stock and when it may be time to tighten up my stops or sell a stock. I trade differently and really prefer the daily interval based on close of each day.