Let’s go through a few readings.
Advance-Decline Line
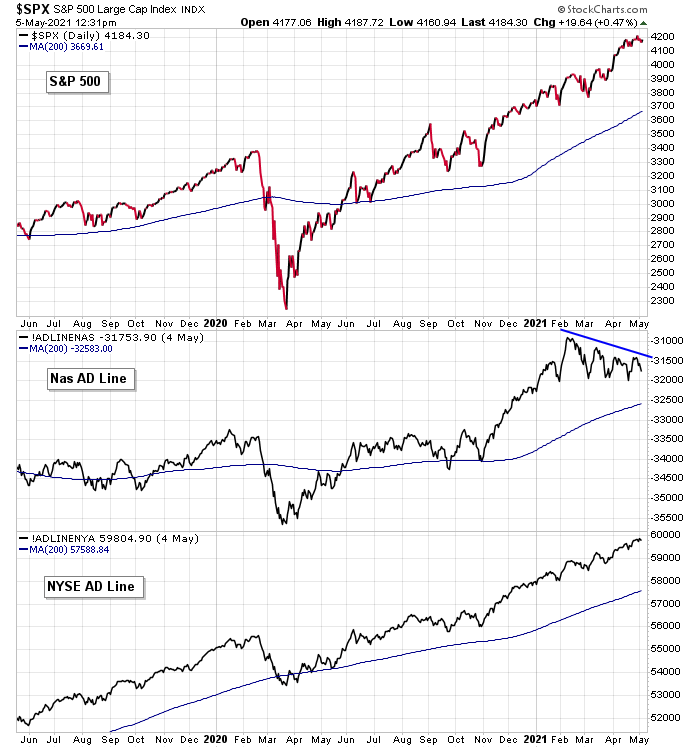
The Nas AD line has been putting in lower highs for three months but is neutral overall. Deterioration? Yes, but it’s not extreme. At the NYSE, the AD line is relentlessly moving up. Steady support has not wavered.
As a point of comparison, in 2015, prior to the market topping, the Nas AD line had been channeling down for well over a year, and then it fell hard prior to the bottom falling out of the market. This is normal. The Nas is home to many low quality stocks that should not be publicly traded, so the AD line tends to be weaker than one would expect. At the NYSE, the AD line supported the market’s strength by trending higher, but the 4-month downtrend prior to the market drop was a warning.
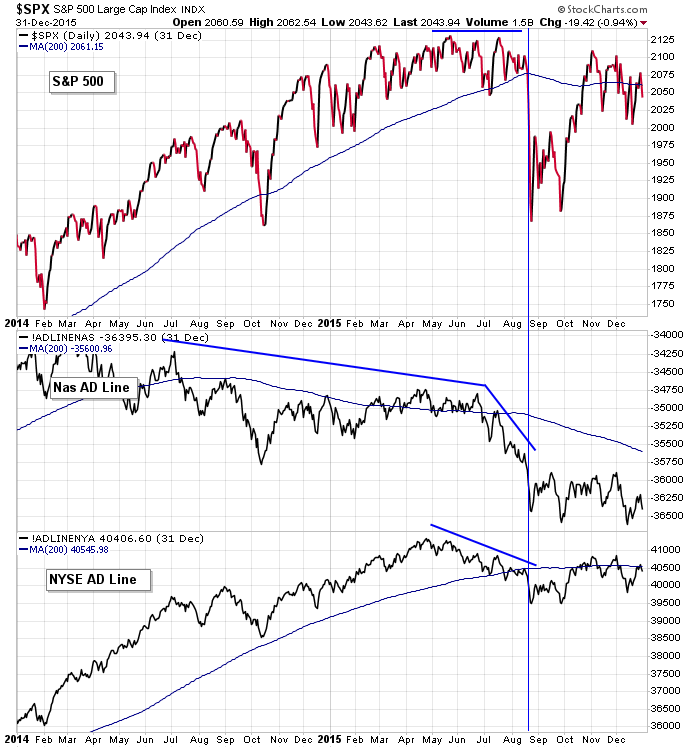
Comment — With the current NYSE AD line steadily rising, and the Nas line merely moving sideways, the market is in good shape. No internal problem is signaled here.
Stocks Above Their 50-day Moving Averages
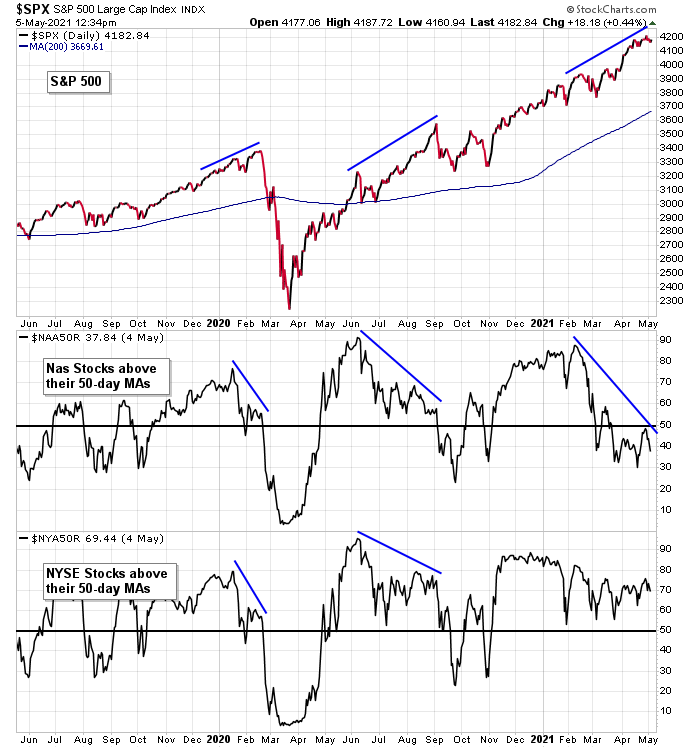
Currently, only 38% of Nas stocks are above their 50-day moving average, far less than the February high and not supportive or further gains. Previous negative divergences, which were less extreme than the current situation, did not end well for the market, at least in the near term. At the NYSE, 69% of stocks are above their 50’s – a print that’s off the high but still pretty good.
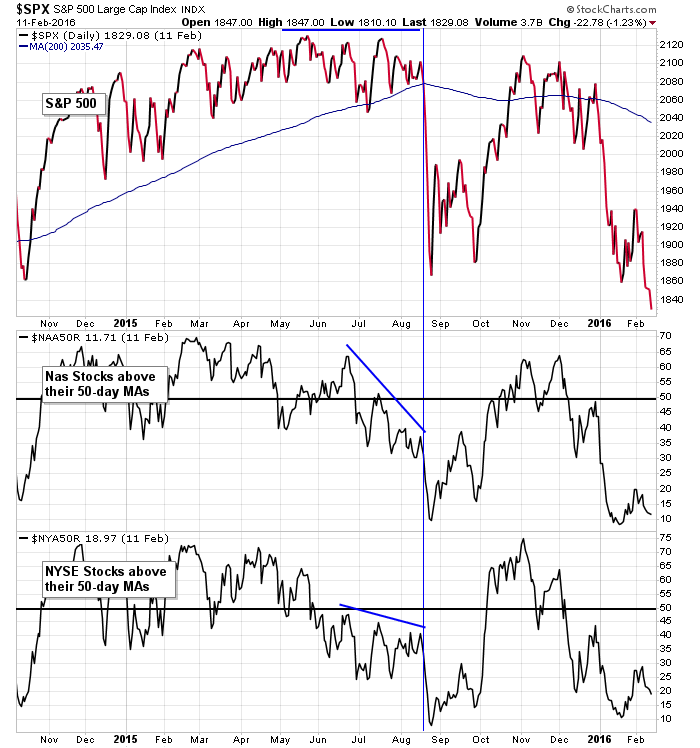
As a point of comparison, in 2015, the prints at both the Nas and NYSE were trending lower and well-below 50% prior to the market dropping hard.
Comment — The Nas numbers tell us to be super careful right now, that stiff correction is likely, absent immediate improvement. But the NYSE tells us we shouldn’t be overly concerned. Keep stops in place, but don’t abandon the market altogether.
New Highs
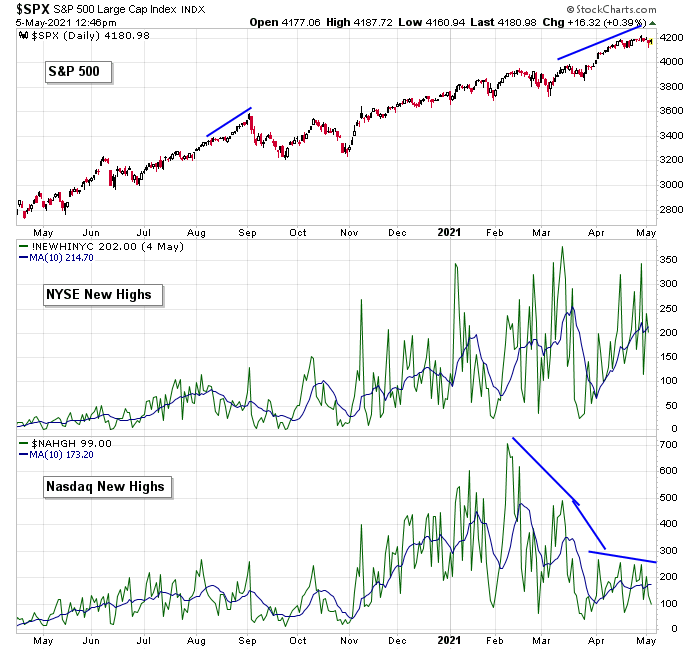
New highs at the NYSE are printing at a solid level, fully supporting the market’s strength. But new highs at the Nas have been well off their highs for six weeks. This is not what you’d expect given the Nas ticked a new high last Thursday.
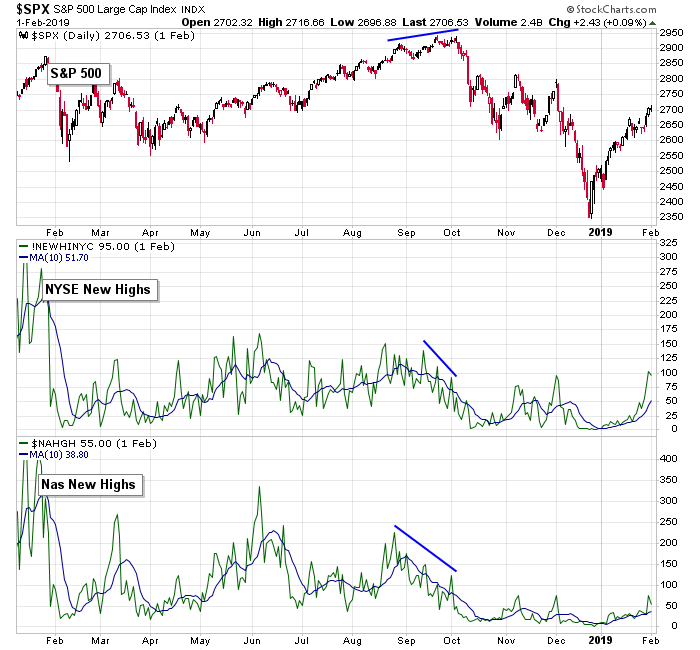
In 2018, as the market pushed higher, new highs at both the NYSE and Nas trended against the market for an entire month before the bottom fell out hard.
Comment — Once again, the Nas suggests trouble is looming while the NYSE supports the market.
Per the NYSE, the market is strong and trending up and supported by the internals. But per the Nas, there are major warning signs.
What’s more telling? Which exchange is the real pulse of the market?
The answer is: We don’t know for sure, so we’re best off doing two things.
1) Recognize what the Nas is trying to tell us, and don’t ignore it. At the very least, keep tight stops in place. This is not a time to go for the jugular or give positions time and space to move around.
2) Rely more on the best indicator, which is success/failure/movement of trades. Are stocks trending or chopping in place? Are breakouts working for failing? Are stocks following through? Are stocks acting well? The answers to these questions tell us more than the breadth readings.
Subscribe to Leavitt Brothers research, where we offer market analysis and trading ideas to the financial community.
Not ready for a subscription? Join our email list and be alerted of new content.
Your analysis is excellent,
Thank you very much
We are close to a near term bottom.
Excellent review, thanks.