It’s been a heck of a 2025 so far. New Years. Inauguration. FOMC. Earnings. DeepSeek. And now tariffs. There’s been no shortage of news that has caused sudden market moves.
So far, minimal damage has been done. There are winners and losers, but the overall market has done just fine.
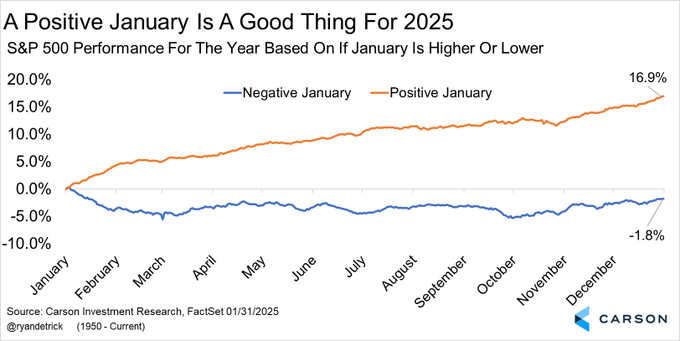
Below are some studies that use January’s performance and the November-January quarter to establish future price tendencies.
When January is up, the market tends to have a very good year – the S&P mostly trends up and closes at its high with a 16.9% average gain. But when January is down, the market tends to be flat the rest of the year, with an average loss of 1.8%. This year, January posted a 2.7% gain. See the chart below for what has typically played out since 1950 as a function of January’s performance. (@RyanDetrick)
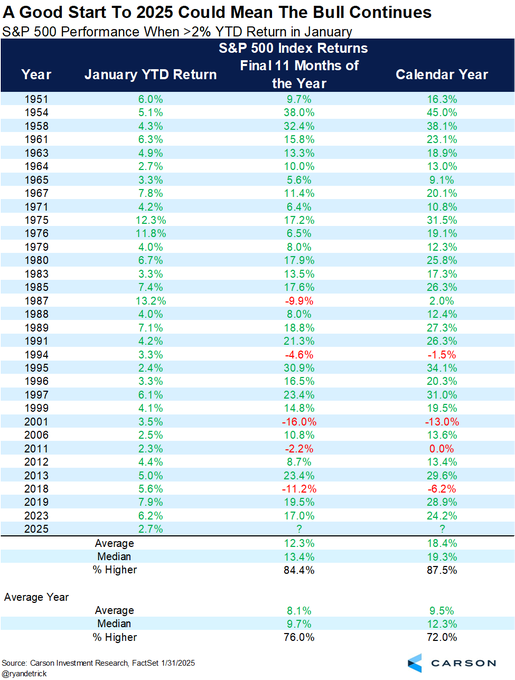
Digging into the numbers a little, when the S&P posts a gain in January greater than 2%, the market posts a gain 84.4% of the time (vs 76% for all years) the final 11 months of the year, with an average gain of 12.3% (vs 8.1%). A good January is indeed a good sign for the rest of the year. (@RyanDetrick)
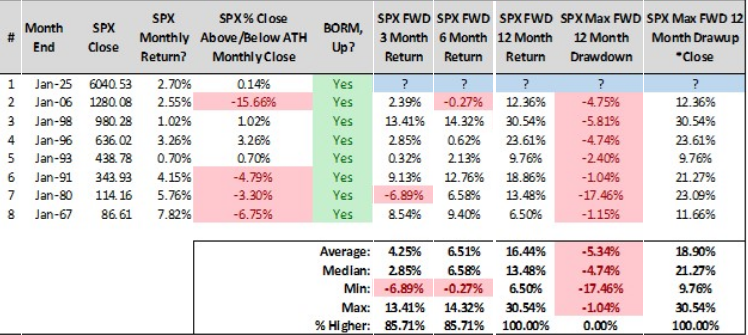
The S&P formed a bullish outside reversal month (there are different definitions of this). The index traded below December’s low and above December’s high and closed with a gain. This had happened seven previous times in January since 1950. Three and six months later the S&P was up 6 of 7 times with a median gain of 2.85% and 6.58%. Twelve months later it was up all 7 times with a median gain of 13.48%. The data is summarized in the table below.
Also, the median 12-month drawdown was about 5%, so despite the bullish candle formation, there tends to be selling at some point. But the median 12-month drawup was over 20%. (@SJD10304)
February is the second-worst month of the year behind September. But it has a strong tendency to follow a trend. When the quarter preceding it (Nov-Jan) is up 2% or less, February is 9-16 (up-down), with an average loss of 1.3%. When the quarter is up 2.0-7.25%, February is 15-10, with an average gain of 0.3%. And when the quarter is up more than 7.25%, February is 17-8, with an average gain of 0.96%. Here are the numbers. This year, the November-January quarter gained 5.9%, putting February the middle column below. (@WayneWhaley1136)

The market has digested a lot of news. If it can continue holding, it’ll be positioned to do well this year.
Jason Leavitt