In the face of tariffs, elevated inflation, high interest rates, and a war between Israel and Iran, which the US briefly joined, the market has moved to an all-time high. I’ve said it 1000 times – turn your brain off and just trade the charts. Opinions, especially political opinions, will crush you in this business.
One by one, studies point to higher prices, not just now or for a few months, but well into next year. Here’s a summary of those studies.
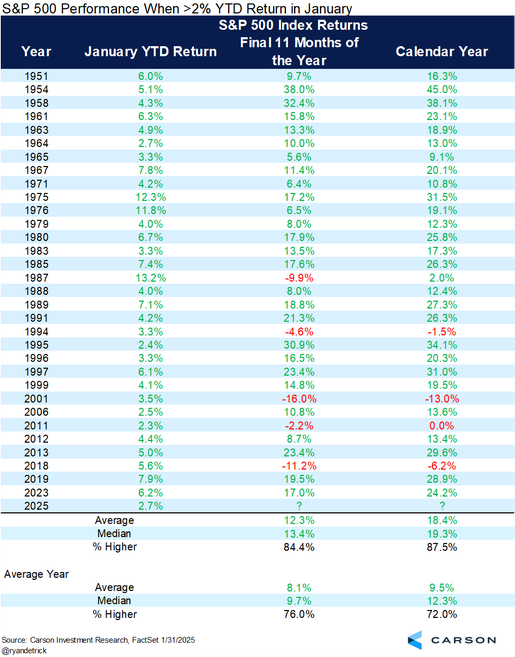
We started the year with a 2.7% gain in January. Gains greater than 2% have been followed by an 87.5% win rate and 18.4% average gain for the full year. The month ended nearly two weeks after Trump took office, so there was plenty of time for the market to factor in the event.
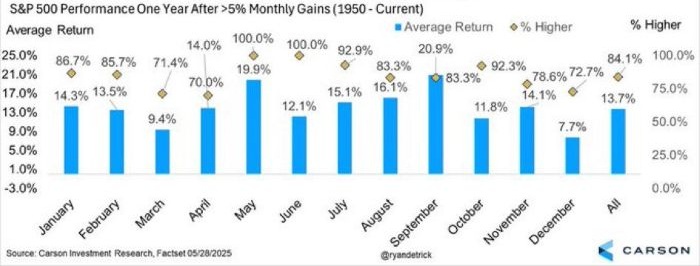
The S&P gained more than 5% in May. Since 1950, when this has happened, the market gained an average of 19.9%, with a 100% win rate over the following year. May is not typically a strong month, so when it’s strong, it bodes well for the future.
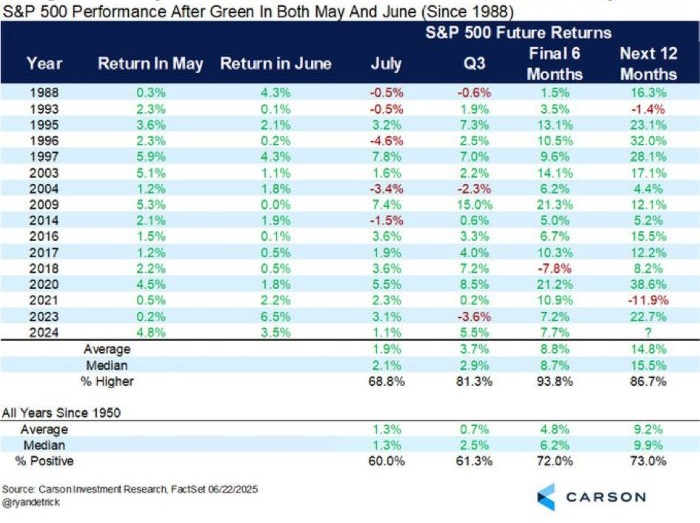
Similar to the above study, when both May and June post gains, the market has been good, but not great, in July, but then very good during Q3, the final 6 months of the year and the following 12 months. The win rates and average gains are all well above average.
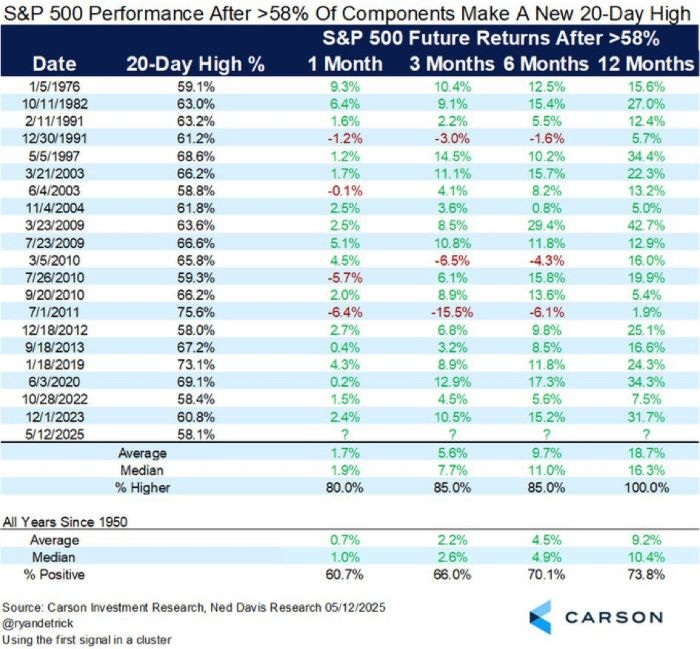
On June 12, more than 58% of S&P 500 components hit a 20-day high. This bodes well for all forward time frames. One year later, the market has never been down, and the average gain has been 18.7%.
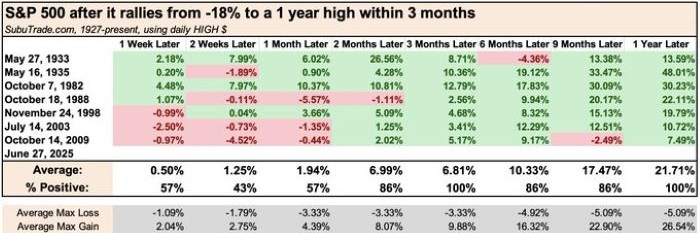
With the S&P printing a 1-year high on June 27, the index had officially gone from being down 18% to a 1-year high within three months. Following previous occurrences, the forward returns looking out one month are mixed, but beyond that, the averages have leaned heavily in the bulls’ favor. One year later, the market is up 100% of the time, with a 21.2% average gain.
And with the Nasdaq printing a new high two weeks ago, it has gone from a 20% drop to a 1-year high within three months. Historical gains have been mixed over the following two weeks, but then it’s all green. The 1-year average returns are enormous – a 100% win rate and 40.5% gain.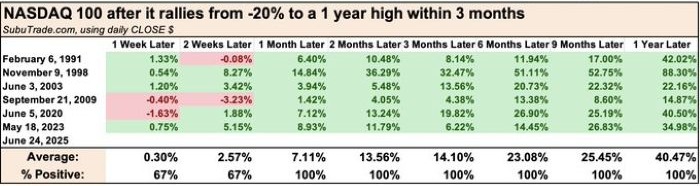
The S&P posted a loss during Q1 but then bounced back with a gain > 10% in Q2. Previous occurrences have seen the market post a gain 100% of the time for Q3 and Q4, with an average final 6-month gain of 15.9%.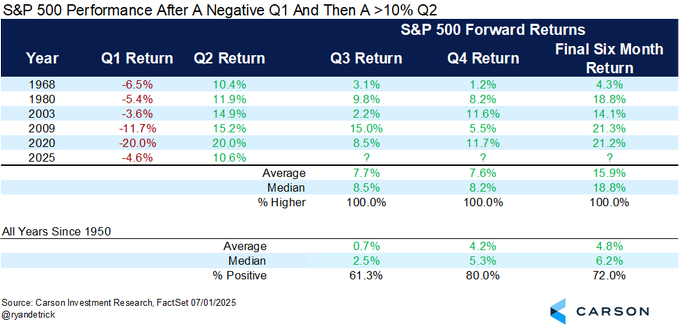
The S&P recently rallied 25% in less than a quarter. Most quants adhere to the calendar months and quarters, but Wayne Whaley looks at every 21-day or 3-month period to unearth studies that don’t trigger when being forced to use the exact beginnings and endings of months.
Between April 7 and July 7, the S&P rallied more than 25%. It was the 6th occurrence in the last 50 years. Previously, the market was up four weeks later every time, and looking out in 2-month intervals, the market has never been down. The 1-year average return is 31.7%. This is incredible. A strong move is meaningful. Bounces can take place at any time, but a huge move in less than three months sends a different message.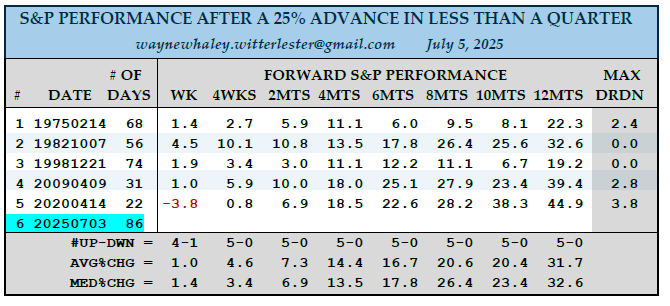
The S&P was down greater than 7% during the first half of the year but closed at the end of June with a year-to-date gain. After previous occurrences, the market leaned up the final six months of the year, but if there was no recession, the market had a 100% win rate and gained an average of 11%.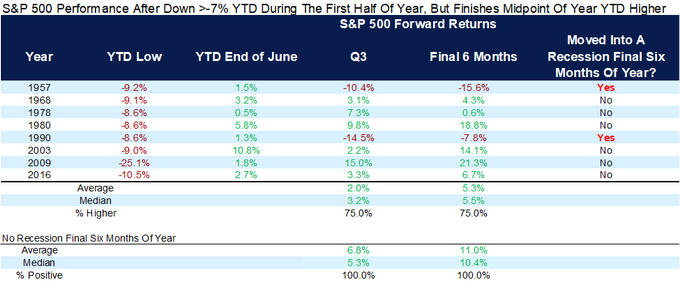
And as a bonus, July has been one of the best months of they year, with solid gains over the last 10 and 20 years and going back to 1950.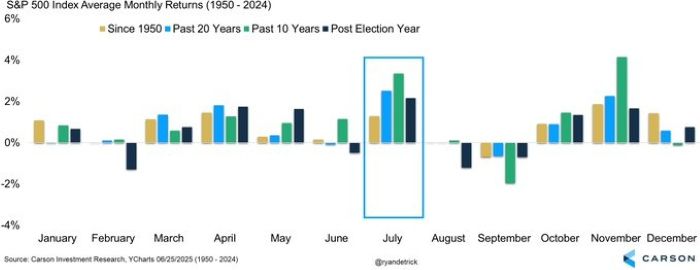
Another bonus: the market has never topped in June (it didn’t this year either), and it rarely tops in August and September, so the high that was just printed is very likely to be taken out.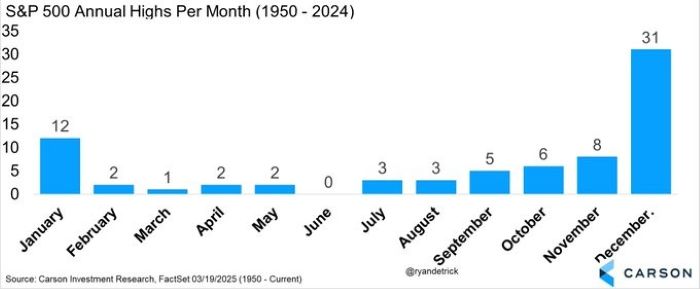
The S&P and Nasdaq are at or near new highs.
There are obvious themes playing out. These include: AI, space, nuclear energy, self-driving cars, humanoid robots, and quantum computers.
There’s a pretty big wall of worry, so many traders and investors are on the sidelines or not fully participating.
The market has done well in the face of bed news.
The market has done well when it has historically struggled.
And a lot of quant studies point to higher price well into next year.
All signs point to the trend continuing.
The biggest roadblocks are: tariffs, which are not resolved and could still balloon and hold the market back.
With new highs being hit, we need to be more alert. This could be an important point. The market can accelerate upward, or it can push a little higher and then top. We need to be more alert now than the last few weeks the indexes have grinded up here. But looking out, the path of least resistance is definitely up. I expect higher – perhaps much higher – prices later this year and into next year.