Good morning. Happy Thursday.
The Asian/Pacific markets closed mixed (all gains and losses were less than 1%). Europe is currently down across the board (there are no 1% movers). Futures here in the States point towards a small gap down open.
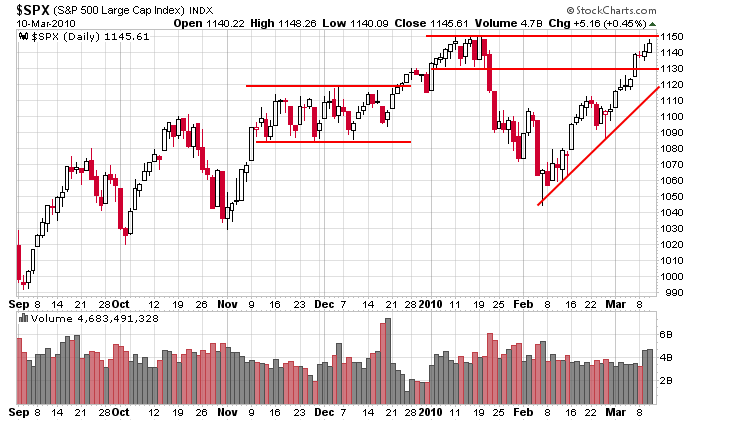
This is what’s on my mind. By virtually all metrics, the market has been on a heck of a run lately. The S&P has been up 13 of the last 17 days, and 8 of the last 9 days it has taken out its previous day’s high. That’s some pretty steady buying pressure. Every little intraday dip gets bought. Here’s the daily chart. The index is within 5 points of recovering its Jan/Feb losses.

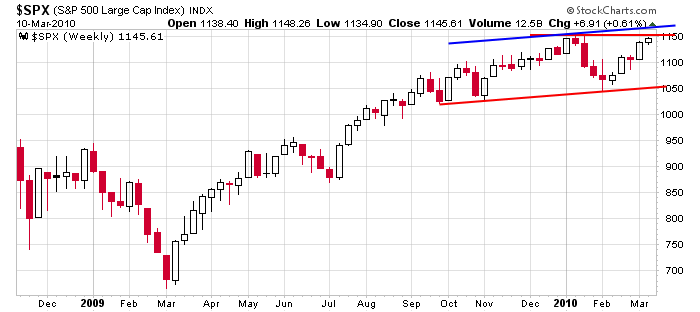
Backing up, here’s the weekly. The blue trendline is drawn parallel to the red support line. If 1150 is taken out, I don’t think it’ll be clear sailing ahead. In fact I’m tempted to say the blue line is stiffer resistance than 1150.

Also of note from the chart above is the extent of a pullback that can play out while the uptrend is maintained. The index could drop all the way to 1050 and still be considered in good shape. Know what time frame you’re trading. More after the open.
headlines at Yahoo Finance
today’s upgrades/downgrades
this week’s Earnings Reports
this week’s Economic Numbers
0 thoughts on “Before the Open (Mar 11)”
Leave a Reply
You must be logged in to post a comment.
can you ck your info email acct as I
have an errot on my billing thx ed
Ed…I have emailed you.
Jason
“I’m tempted to say the blue line is stiffer resistance than 1150.”
I tend to agree.
Great read as always.