Good morning. Happy Monday. Hope you had a nice weekend.
The Asian/Pacific markets closed mostly up – China gained 2%. Europe is currently up across the board – there are no 1% winners. Futures here in the States point towards a moderate gap up open for the cash market. This comes off a week the market moved up, but on a couple occasions could not hold its early gains.
The big events this week are the end of the quarter on Wed and the latest employment numbers Fri.
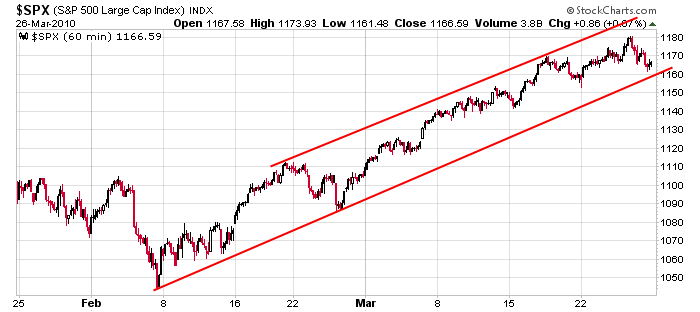
Here’s the 60-min S&P chart…very steady 7 week uptrend.

There are many warning signs out there; there are many breadth indicators in overbought territory. This has been the case for the last week, and instead of pulling back, the market so far has chosen to move sideways. More time is needed to set the stage for another leg up. For now my attitude remains the same. The trend is up, but I’ve shifted into conservative mode for the time being. I’d like to see the market work off some of the overbought condition before getting aggressive again on the long side. More after the open.
headlines at Yahoo Finance
today’s upgrades/downgrades
this week’s Earnings Reports
this week’s Economic Numbers
0 thoughts on “Before the Open (Mar 29)”
Leave a Reply
You must be logged in to post a comment.
Jason, would you list the breadth indicators you’re using? Thanks
Also, your thoughts on candlesticks if you’ve got the time, specifically normalization. Candlesticks seem to be a pictorial of breadth, but images are subjective ergo the normalization. One thought was to normalize to the low of the day, but that would miss gaps. Normalizing to yesterday’s low would depend if the stock was going up or down. In the end it seemed I was reinventing the ATR. Is there a bullish breadth, a demand breadth or what is the interpretation intent? Thanks again.
Hey liar liar you taking the day off?
Rich…
I use candlestick charts, but I don’t use candlestick patterns. And I don’t know what you’re talking about when you say ‘candlesticks seem to be a pictorial of breadth.”
The breadth indicators I use:
new highs
new lows
advance-decline numbers
advance-decline volume numbers
percentage or number of stocks within a group trading above various moving averages
on a shorter term basis, I’ll look at the new 10-day highs or 10-day lows instead of 52-week highs and lows
put/call – it’s not a breadth indicator but I look at it anyways
I use NYSE data, not Nasdaq because there are too many crap companies at the Nas that distort the indicators.
Jason
greetings mr rich, i am not the in-house editor here you know 🙂
Thanks Jason. How do you define breadth? I thought it was the difference between the high/low, open/close, etc. and a candelstick would be a pictoral representation of those breadths.
liar liar; just pulling your chain. Would still like to know your stop method(s).
Rich I’m sure there are indicators that use the O, H, L and C and yes a candlestick points those out. When I think of breadth, think of the beneath the surface numbers I mentioned above.
Jason