Good morning. Happy Monday. Hope you had a nice weekend.
The Asian/Pacific markets closed mostly down – there were a couple 1% losers. Europe is currently mostly down – losses are minimal. Futures here in the States point towards a positive open for the cash market. This comes off a very weak Friday and the market’s first sizable weekly loss since early February.
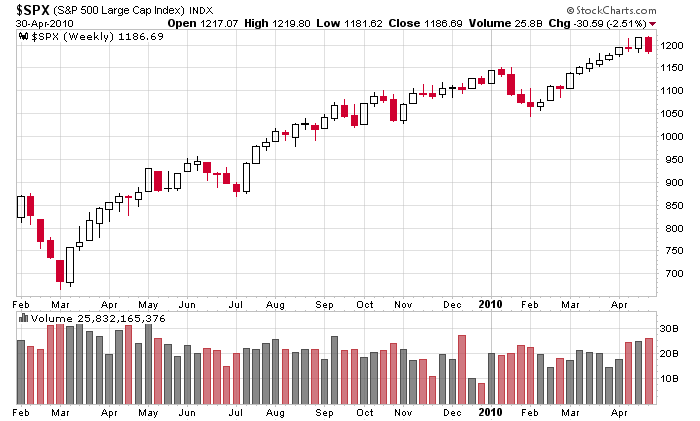
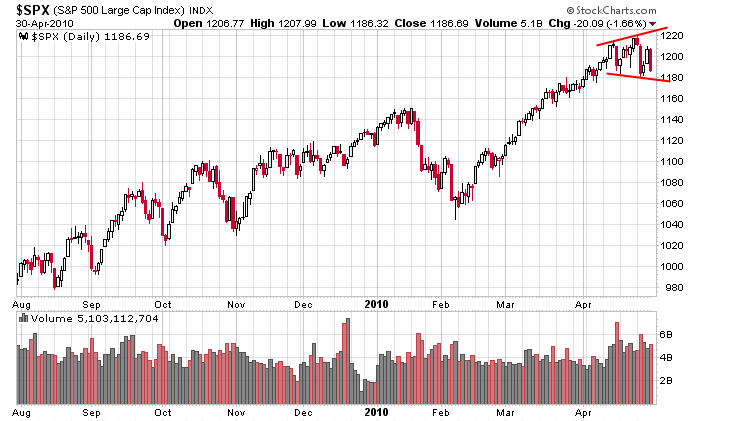
I don’t have much to add to my weekend report. The long term trend is still solidly up (see weekly chart below) and the shorter term chart seems to be topping. Volume has picked up, the intraday ranges have grown and volatility has expanded – all items that more likely than not are indicative of a top rather than a simple consolidation period (see daily chart below).
The weekly…

The daily…

As a trader, I’m trained to not care if the market goes up or down. I’ve ridden the uptrend for all it’s worth, and if the market wants to rollover and either temporarily correct or trend down, that’s perfectly fine. I’m not one to argue with the market – it has the final say. I’ll do whatever it tells me to do. I trade what is happening, not what I think should happen. More after the open.
headlines at Yahoo Finance
today’s upgrades/downgrades
this week’s Earnings Reports
this week’s Economic Numbers
0 thoughts on “Before the Open (May 3)”
Leave a Reply
You must be logged in to post a comment.
There is a head and shoulders with a neckline at 1180. Something to watch for?
head-n-shoulder patterns are my least favorite. If you trade them well, good for you. I’ve never made any money trading them, so I don’t pay any attention to them.
So what’s your favorite pattern? I like Hawaiian.
Plaid.
I like simple consolidation patterns within trends.
I got the, ‘Before the open’ email this morning.
While I would agree with Jason’s comments on “H&S” formations, one may also want to consider that there are other indicators pointing to a potential top of some degree forming here, e.g. we have just completed an “outside” week to the downside with a close below the prior week’s close. In additon, for EW fans, we may have 5 wave declines in progress to the downside in progress with today’s rally being a counter trend 3 wave affair. We are overbought, overbullish etc on longer term indicators at levels similar to the 2000 & 2007 tops. I’m just saying….
The problem is the market has been showing signs of a top for several weeks and here we are, the overall trend is still up and short term, the most bearish thing that can be said is the market is in consolidation mode.
I won’t ask you to define consolidation, but could you give us examples with beg/end date and time frame (minute-hour-daily)? Thanks
There are many examples of consolidation patterns in the Archives.
In words, I like stocks that rally, rest for a couple weeks and then rally again. It’s that second rally I like to jump on.