Options expire this Friday, so let’s take a look at the open-interest on SPY, DIA, QQQQ and IWM to see if they hint at movement the rest of the week. Here’s the theory: the market conspires to cause the most pain, to cause the most number of people to lose the most amount of money. If the market is to accomplish this, what does it need to do this week?
SPY (closed 109.51)
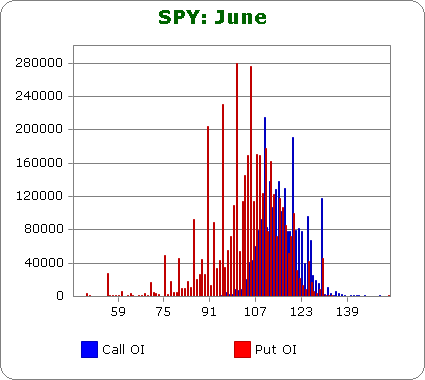
Puts out-number calls almost 2-to-1, so bearish sentiment remains.
Call OI is highest between 109 & 120.
Puts OI is highest at 116 and below with several very high spikes in the 90’s..
There’s lots of overlap between 109 & 116, and since puts out-number calls, a close in the top-half of the range would cause the most pain. But unlike previous months, someone will make money – there’s no place to close were most options will expire worthless. Given Monday’s close at 109.51, the market needs to move up a couple points to cause the most pain.
DIA (closed 102.14)
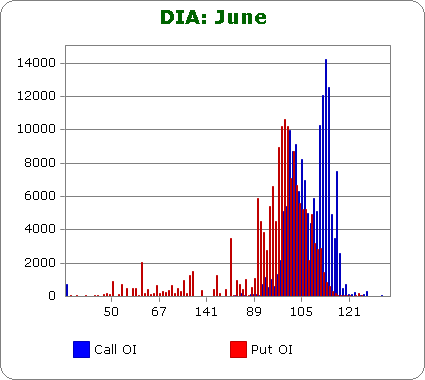
Puts and calls are equal.
Call OI is highest between 101 & 105 and then again between 111 & 114.
Put OI is highest between 98 & 102.
There’s a little overlap in the 101-102, so a close right there would cause the most pain. With today’s close at 102.14, the market can’t move up too much more the rest of the week or else the call holders will actually make money. But high DIA OI is 10K…much less than the 100K which is routine for the SPY. So even if DIA call buyers make a few bucks, they may not make enough to compensate for the losses from SPY call buyers.
QQQQ (closed 45.49)
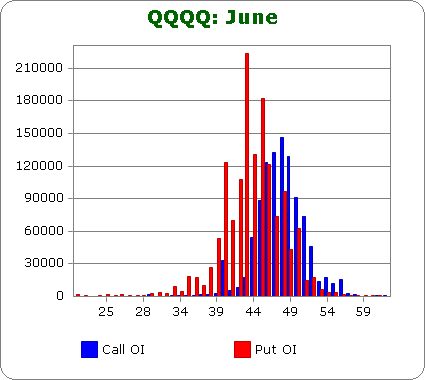
Puts out-number calls by 1.4-to-1.
Call OI is highest between 45 & 50.
Put OI is highest between 40 & 48.
There’s overlap between 45 & 48, and since puts slightly outnumber calls, a close in the upper half of that range would cause the most pain. With today’s close at 45.49, the market needs to move up a little the next couple days to accomplish the mission.
IWM (closed 65.35)
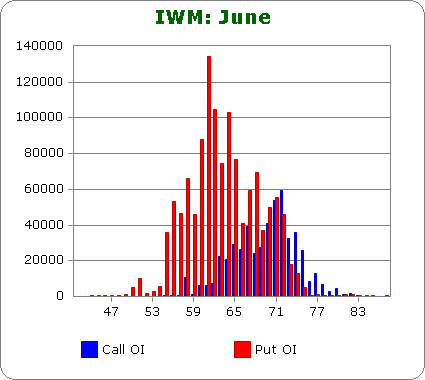
Puts out-number calls by 3.3-to-1.
Call OI ramps up between 63 & 72 with 70, 71 and 72 being the highest.
Put OI is highest between 57 & 72 with the highest ticks occurring at 61, 62 and 64.
The most obvious overlap comes in the area of the high call OI spikes (70-72), but since the put OI is so much higher than the call OI, let’s focus on the puts. The higher the close, the better, and with IWM closing at 65.35 today, a move up is needed, but as long as the market doesn’t move down much, most of the put owners will lose.
One more just for fun.
TZA (closed 6.85) – this is 3x inverse small cap ETF.
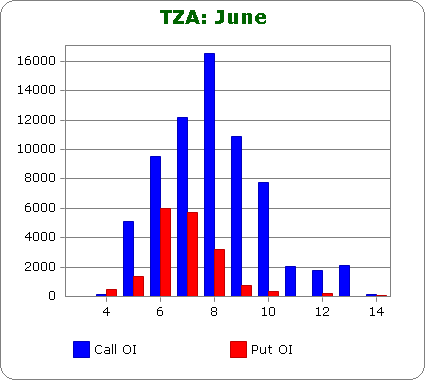
Call OI continues to dominate.
Call OI is highest at 6, 7, 8 and 9.
Put OI is highest at 6 and 7.
A close in the mid 6’s would cause lots of pain. There may be a few call buyers at strike=5 that make money and a few put buyers at strike=8 that make money, but overall, most would lose. With the stock closing at 6.85 today, a small move down (which means the market moves up) is needed the next couple days.
Overall Conclusion: The bears continue to trade in anticipation of a big move down and as of today’s close, they’ll make a couple bucks, but not too much. A move up the next couple days would cause more pain,
11 thoughts on “Using Put/Call Open-Interest to Predict the Rest of the Week”
Leave a Reply
You must be logged in to post a comment.
So are you suggesting that the moves which would “cause the most pain” are likely to happen over the next few days?
Nash…absent extreme outside forces, the market tends to move in the direction which will cause the most pain, but we are hardly in a time without outside forces. News out of Europe trumps everything right now. I glance at these numbers each month, but I don’t trade off them.
Jason
Jason, looks like you were bang on. What a rally today. Friday is 4 days away but not looking good for the puts.
very nice. I like it.
Jason,where do you expect SP500 on Friday?thanks.
Robert…I have no idea. I keep these numbers in the back of my mind, but I don’t trade off them. I’d never enter a position under the assumption something is going to happen just because the put/call is swayed one way or the other.
Jason, i am a subscriber to current pain and it shows me 95 for SPY.why are your numbers so much higher?thank you.
Robert…I have no idea. Maybe the numbers you’re looking at know where calls and puts were purchased and therefore how much they’re currently worth?
There’s huge put OI above 99…they’ll expire well in the money if SPY closes at 95. That doesn’t seem right to be…if the market wants to create the most pain.
Is the raw data available?