Good morning. Happy Wednesday.
The Asian/Pacific markets closed mostly up. There were no 1% movers in either direction. Europe is currently mixed and with a bullish bias. Futures here in the States point towards a flat open for the cash market.
This comes off a day the market rallied hard to recapture its large losses from the previous day and settle near the middle of its recent range. From here anything goes. A good up day will put the indexes at 3-week highs and within striking distance of multi-year highs. A bad day will put them at their lowest levels since early Feb. With the ups and downs and inability for either the bulls or bears to take control, anything goes.
The wild card is still Libya and the Middle East. Wall St. seems to have digested the situation in Libya pretty well, but what if protests spread to other areas such as Saudi Arabia, a much more influential oil exporting country.
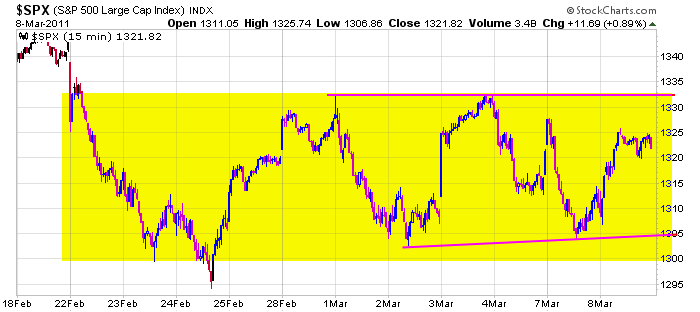
Here’s the 15-min SPX chart going back 13 days. Other than a brief time on the 24th, all the data fits within a 32-point range. Rallies get sold, dips get bought. If you’re bullish, you’ve gone back and forth between being happy and being worried. The same for the bears. I’ve been playing it safe…that means shorter term trades and a lot more cash. More after the open.

headlines at Yahoo Finance
today’s upgrades/downgrades
this week’s Earnings Reports
this week’s Economic Numbers
0 thoughts on “Before the Open (Mar 9)”
Leave a Reply
You must be logged in to post a comment.
The general thrust of the market (looking at the daily charts) has been up
little bit each day, followed by one or two down days, and then a resumption
of a little bit up each day. Now we see a slightly different story, ‘up’ big
one day, ‘down’ the next, so no real patterns have emerged out of this
rocking back and forth scenario which we are presently in. HW
Well, in the NDX index, there is a CLEAR pattern. It is called a Bear Flag and it developed inside a larger Megaphone top pattern. These are classic patterns for declines. i will be really surprised if the market goes up at this point even though it may go up some very short term. Having said that, Once the index gets a 10% retracement, then I think it can advance into early to mid summer. Just my take on things. Alan
its a new dance craze –a run to the up and a jump to the side a slide up and turn with a slide to the down and a jump to the side – a leap up and craw to the top,turn and run down and a leap to the side—its called the sideways scalp–buy in the bottom third –sell top third
Aussie JS: are you hot for teacher, I wonder? your spelling
has improved dramatically over the last week or so. HW
Looks like we are topping. The see/saw can go on for sometime.
My doctor says it is manic and he would know. He is up and dowm on the market like an elevator.
June is the edge of the cliff and most traders plan to avoid the edge by dropping out before seeing if QE2 is dead. Can’t be good. Watch for Ben to start dropping hints soon.
Patiences and stops and as Jason says Play what you see.
Looks to be some sort of a triangle formation to me which is close to a resolution,i.e. up or downside breakout. Since the larger trend is up, the probabilities are for an upside breakout. A new high should get everone super bullish and set up the final high, perhaps in Q2 or Q3. If history is any guide, we can start looking for a broadening top formation and a two sided trading environment with increasing volatility.
The lower probability is for a downside breakeout with the top already in place, implying that we’re already beginning a broad topping formation that may complete in Q2. Again, increasing volatiliy should be expected. Something to consider, depending on your trading time horizon.
Howard, say “hello” to MAX!
Max says hello. As a matter of fact
I served him breakfast in bed
today. So spoiled, spoiled!
Ps. I have 3 different buy recommendations
on EEM 1. INO.com 2. Stockcharts.com
and 3. Najarian morning call.
when is quad whitching opts ex
i am excentric
sorry I have been out of the loop, but Steamboat is not a mecca of technology.
12500 area is in the cards.
Pete M
a breakout of the triangle to the downside would give us the downside limit to the broadening sideways–jaws of death–terminator
as a impatient being i would prefer a simple old fashion crash impulsive wave 3
or hopeing for a few flash crashes to un nerve everyone