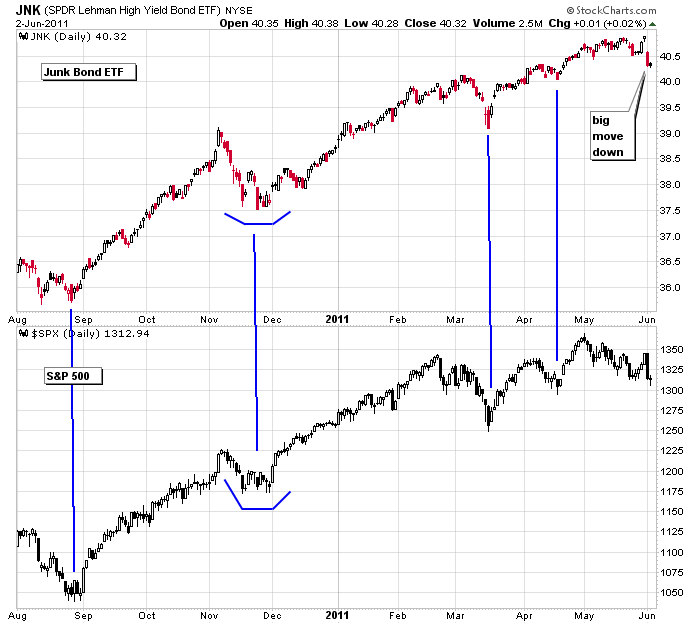
Here’s the high yield junk bond ETF, JNK charted vs. the S&P 500 over the last 10 months. The correlation is obvious.

Junk Bonds: They are lower grade and therefore higher risk. The odds of default are higher than other bonds, so to attract investors, they have to pay a higher yield.
Why are they important? They signal 1) Wall St.’s appetite for risk and the 2) amount of money flowing around.
1) When investors are willing to “gamble” with junk bonds instead of running to the safety of higher grade bonds offered by solid companies that are very unlikely to default, it’s a bullish sign for the market. This is similar to how the small caps tend to lead the market up and down. When money flows into and out of speculative issues, the market tends to follow. 2) When investment dollars are limited, money flows to safe, conservative vehicles. Introduce a little more money into the system, and that money will find its way into slightly less safe and less conservative issues. Introduce more money, and well, you get the point. Continue on with this sequence, and eventually there’s so much money flowing, it has no choice but to find a home in speculative issues. At the end of the day, the amount of money flowing, or liquidity, determines whether the market goes up or down. So when junk bonds are bought up, it means there’s lots of money flowing.
Why is yesterday’s big drop significant? First off, 25 cents of that drop was due to JNK paying its monthly dividend. But the rest of the drop was due to plain old selling presumably because investor’s appetite for risk has decreased. This, as explained above, is bearish.
Let’s continue to watch JNK. If it lags, the market isn’t likely to make much headway to the upside.
0 thoughts on “Is the Junk Bond Market Trying to Tell Us Something?”
Leave a Reply
You must be logged in to post a comment.
Let’s see how tomorrow’s job report is going to work out.
After the ADP announcement yesterday, a bunch of guys
lowered their forecasts, thus making it easier for
the Bureau of Labor Statistics to jump over tommorow’s hurdle.
2) Friday, at the end of day, gives us weekly data, which
will be heavily analyzed by all of the market technicians.
No one has lowered the numbers. The country didn’t create a lot of domestic jobs. Most of the jobs are going overseas. People are buying for price and not considering where the jobs are being created.
Listen, Neal: Bennie Boy has the engines running
full steam on the SS Titanic. There’s not even
time to slow down if an iceberg is dead ahead.
Just like going 65mpg on the Chicago Expressway
and you miss the exit because you were too busy
Twittering and driving at the same time. Gheez,
multi-tasking does have it’s drawbacks, doesn’t it?
tlt (bonds) were down 2% today which is a huge move? risk on?
great article Jason
forget the fed they have had it
but we know hedgies/banks look at info like above and especially interest rate curves/yeilds
usa selling is coming from europe,where we know they are tightening their belts–both govts and banks–thus less liquidity
in the face of that what can the fed do –nothing but resign
please keep us updated as i dont have access to this type of usa data
jason: your chart shows that a low in jnk=a low in spy? bullish?
That’s been the pattern, so if the market continues down and JNK firms and moves up, it’ll be a positive divergence.
Each time the bonds sold off and the market followed it was bought back with furry. How do we know this time will be any different? We don’t, so what is our exit strategy before losing too much?
Personally I sell first and ask questions second. I exit and then if I’m wrong, I re-enter. I’d rather pay a little extra in commissions then sit and hope the market turns around.
Unfortunately the data for JNK on stockcharts is unreliable. Im unsure why, but for years it has been at odds with pretty much all other data providers. This will have some affect on your otherwise excellent analysis Jason.
Heres several other sources with identical, different data.
http://chart.finance.yahoo.com/z?s=JNK&t=1y&q=b&l=off&z=l&p=s&a=v&p=s&lang=en-US®ion=US
http://www.reuters.com/finance/stocks/chart?symbol=JNK
http://www.nyse.com/about/listed/lcddata.html?ticker=JNK&fq=D&ezd=1Y&index=5
tpb…you are right. I should have known better and used a chart from a different service. Stockcharts.com mess with the charts of all stocks that pay a dividend, so it’s not just JNK that’s unreliable, it’s all dividend paying stocks. But looking the links you posted, the essence of the chart remains the same.
all the bulls have to do is turn the charts up side down and instead of pushing the buy button u press the sell button–its simple