Options expire this Friday, so let’s take a look at the open-interest on SPY, DIA, QQQ and IWM to see if they hint at movement the rest of the week. Here’s the theory: the market conspires to cause the most pain, to cause the most number of people to lose the most amount of money. If the market is to accomplish this, what does it need to do this week?
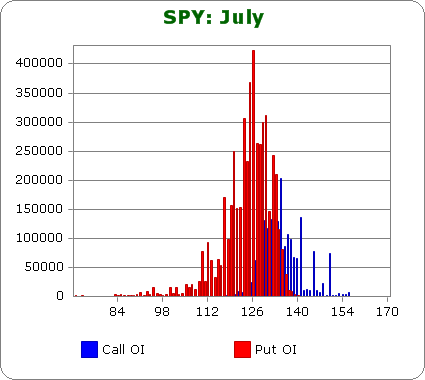
SPY (closed 131.97)

Puts out-number calls 3.0-to-1.0 – much more bearish than last month.
Call OI is highest between 129 & 138 and there’s a spike at 141.
Put OI is highest between 117 & 134.
There’s overlap between 134 & 138, but since put OI is so much greater than call OI, let’s focus on those. With today’s close at 131.97, the top couple strikes are in-the-money. But let’s remember being ITM doesn’t guarantee a profit. Those put owners many have paid a buck or two to buy those puts. Flat trading the rest of the week would cause massive pain. A small move up would cause a little more.
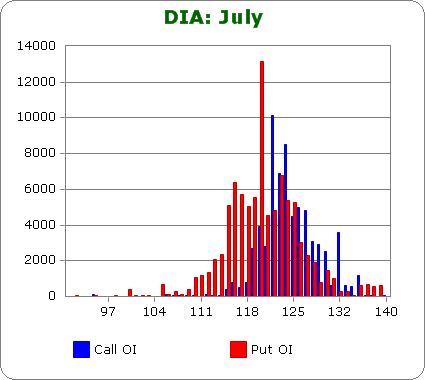
DIA (closed 124.95)

Puts and calls are about equal – same as last month.
Call OI is highest between 122 & 124.
Put OI is highest between 116 & 125.
There’s overlap at 24-25, and with today’s close at 124.95, the market is already positioned to cause lots of pain. But these numbers don’t matter because high OI for DIA is 6,000 contracts. High OI for SPY is several hundred thousand.
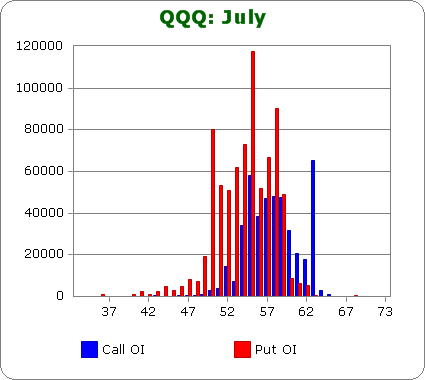
QQQ (closed 57.96)

Puts out-number calls 1.9-to-1.0 – about the same as last month.
Call OI is highest between 55 & 59.
Put OI is highest between 50 & 58.
There’s overlap between 55 & 58, but since puts out-number calls, a close in the top part of that range would cause the most pain. Today’s close was at 57.96 – very close to the top – so flat trading the rest of the week would do the trick.
IWM (closed 83.32)

Puts out-number calls 3.2-to-1.0 – slightly more bearish than last month.
Call OI is highest between 83 & 85.
Put OI is highest between 70 & 84.
There’s some overlap at 83-84, but considering how many more puts there are than calls, expiring the puts worthless will go further causing more pain. With today’s close at 83.32, most of the puts will already expire worthless if the market is flat the rest of the week. Hence flat trading will cause lots of pain. A slight move up would be fine too.
Overall Conclusion: To a greater degree than we’ve seen in a few months, the bears have been out in full force buying put options, but thanks to the greatest 1-week rally in two years and a little follow through last week, the market is positioned to expire most of those puts worthless (even with today’s extreme weakness). Flat trading the rest of the week would cause massive pain; a small move up may cause a little more. Follow through on today’s weakness would allow a few put owners to make money. If the market conspires to cause the most pain possible, it won’t do much the next four days.
0 thoughts on “Using Put/Call Open-Interest to Predict the Rest of the Week”
Leave a Reply
You must be logged in to post a comment.
Jason
could u give us some ind on ur charts as to how the instos are placed re put/calls as compared to the retailers,please
ie –where is the smart money possitioned
I have no idea where the “smart money” is positioned. I don’t care either because most money managers suck. The market has doubled over the last 28 months. How many money managers have doubled too?
Jason- this is in theory; but in past experience does “theory” follow reality. In you opinion and experience is it likely that the mkts will be flat or slight higher this week?
Thx
Michael
My experience is that by the Monday before expiration, the market has already moved to cause lots of pain. The conclusion many months is “flat trading” is needed. Having said that, it’s rare the market moves big the last week so traders suddenly are suddenly profitable. So this does have some predictive value.
What is the value or accuracy of knowing this data as it relates to what the market did by the end of expiration over the last year of publishing this observation?
BOTTOM LINE: Is there any hard data to support that it’s important or valuable knowing PUT/CALL Open Interest Ratio to improve portfolio returns?
BB…as stated above in response to Michael’s question, the market doesn’t wait until the last day to do what it needs to do to cause a lot of pain. That movement typically happens a week early.
I like to keep these numbers in the back of my mind, but I don’t trade off them…especially today when there’s so much political stuff going on in the world.
Thanks Jason
and i would have to agree with u—mutual funds are only interested in getting their fees and looking good
no, i was refering to the institutional hedge compared to the retailer hedge
or the $cpci and $cpce compared to the $cpu retailers opts charts
its the institutions that move the market to line up to the opts strike they want
the institutions/big banks are usually the market makers that write the opts for the retailer