Good morning. Happy Tuesday.
The Asian/Pacific markets closed mostly up. Hong Kong, Indonesia and Taiwan gained more than 2%. Europe is currently down across the board, but only Norway is down 1%. Futures here in the States point towards a down open for the cash market, but considering yesterday’s vertical rally into the close, the market is only set to give back a couple of those points.
The dollar is up slightly. Oil, copper, gold and silver are down.
As I said yesterday, I think today is a semi big day. A handful of markets around the world were closed yesterday, and volume here in the States was light. The current rally is the biggest since this range/consolidation period began two months ago. The S&P is up 120 points, and many stocks are up 10% or more. The first move off a bottom is the easy move. Bulls are excited about buying at lower levels and bears add to the buying pressure by covering shorts. But stocks are much less attractive 120 points later. At the very least, the risk/rewards aren’t nearly as good as a week ago.
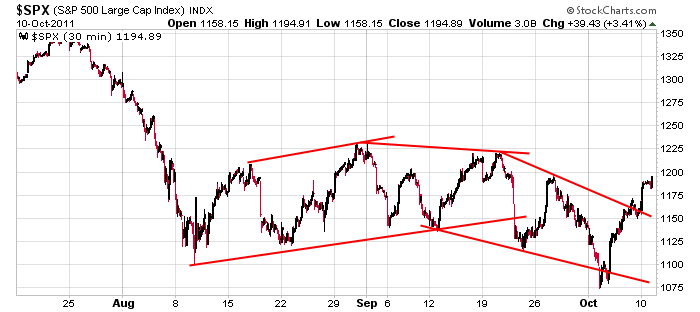
Here’s the 30-min S&P. One could argue it broke out from a falling wedge pattern, but I’m not going to get my hopes up until it clears 1225…and even after that I’ll want a mini correction that gets bought.

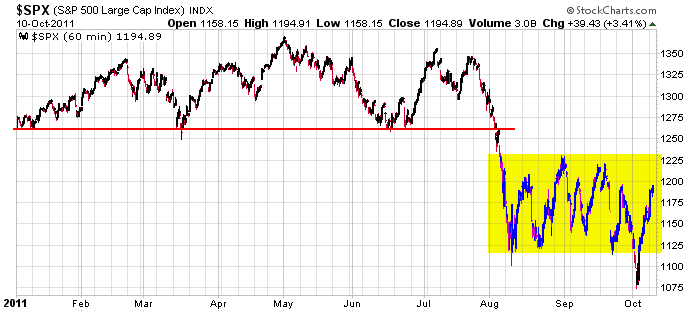
Backing up a little, here’s the 60-min S&P going back to the beginning of the year. It’s a mess. It’s one thing to roll up and down over several months (as it did the first 7 months of the year). It’s entirely different to experience so many sudden reversals in such a short time period. What’s this mean (from a trading perspective)? It means don’t trust any move. Keep trades short term, and forget using stops. Scale out of positions when you can, not when the market gaps against you and you have no choice.

More after the open.
headlines at Yahoo Finance
today’s upgrades/downgrades
this week’s Earnings
this week’s Economic Numbers
0 thoughts on “Before the Open (Oct 11)”
Leave a Reply
You must be logged in to post a comment.
looks like a double headed alien h/s to me
ive seen some of those before
Geez! Dead cats that talk to you and now you’re seeing double headed aliens.
its a alien dead cat then
up to far to fast
big boys accumulating bonuses
leaving in couple hours for salt lake or i would watch for a short
my guess and guess only is big boys want 1200 spx –2300 ndx 100 for some opts
Have a nice trip and forget about trading for awhile.
I thought you were supposed to be in Salt Lake City
attending to the affairs of your ill mother. HW
ESZ1: Don’t like the 9:30 effort. Going to short the next blip. Tarket 1170.
It looks like I was wrong, but it looks like it’s stalling at 1190. Maybe I can break even.
couldnt help my self took a quick ndx short
c u’s later
Well, it looks as though there’s more upside potential here and we could be looking at a test of the 80 week SMA at SPX 1211 or the upper daily bollinger band at 1229. In EW terms, this could be termed a complex corrective pattern that may evolve into an ABC “flat” pattern, i.e. from the AUG low, the “A” wave ended at 1230, the “B” wave ended at 1075, and we’re now watching the “C” wave rally that could terminate at any time from current levels.
Looking at the sectors that make up SPX, you have to concede that the tech, utility, staples & discretionary sectors are the strongest, e.g. relative to SPX, those sectors are closer to their respective upper bollinger band. Until they begin to roll over (tech in particular, in my opinon), SPX 1211-1230 can be achieved. Perhaps we, have to have all sectors overbought on the daily charts before we can see a concerted move down begin.
ESZ1: This leg up should fail, neither dip has volume.
RichE – I have my eye (both really) on SPX 1191. If broken to the downside, I’d want to see signs of impulsive action leading to a test of 1182. But first we may have to go above 1200 and test 1211. This upmove is beginning to look a little “wedgie” and labored to me so I’m on alert, but I don’t want to be guilty of trying to pick the top of this rally off of 1075.
Good morning People
http://www.bigtrends.com/options/short-tuesday-cover-friday-emerging-calendar-trend-spotted/?utm_source=DTW&utm_medium=email&utm_aacterm=FA&utm_content=L+1&utm_campaign=DTWL
The above link is one that I watch every now and then for some interesting insight. What he is saying is that the market has been going up on Monday Tuesday and by Friday is down from those levels (Last week a great exception). food for Thought and worth sharing.
OK! I can count 5 waves down on the 5 minute chart as SPX 1191-1192 is tested. We’re either gathering stength in the 1190s for a break out above 1200 or SPX is preparing to roll over and go lower, perhaps to test 1182. A resumed up move that fails around 1195, and I’ll put my last 1/3 of a full short position on at 1191 on a resumption of the down move.
So much for the 5 waves down count on the 5 minute chart. I’ll forget the short 1/3 at 1191 breakdown idea, at least for now.