Good morning. Happy Thursday.
The Asian/Pacific markets closed down across the board. South Korea lost 2.7%, China 1.9%, Hong Kong 1.8% Europe is currently mixed. Austria is down 1.5%. No other indexes has moved 1%. Futures here in the States point towards a moderate gap up open for the cash market.
Last week the indexes moved to resistance near the tops of their ranges. This week the indexes have rested in tight ranges. Down day Monday, up day Tuesday, down day Wednesday. The net change on the week is slightly down (although it’s up since Monday’s close when the open-interest data said flat or slightly up movement was needed to cause max pain). Here are the daily S&P 500 and Russell 2000 charts. Unless the market completely falls apart today, we have little flag patterns within mini uptrends.
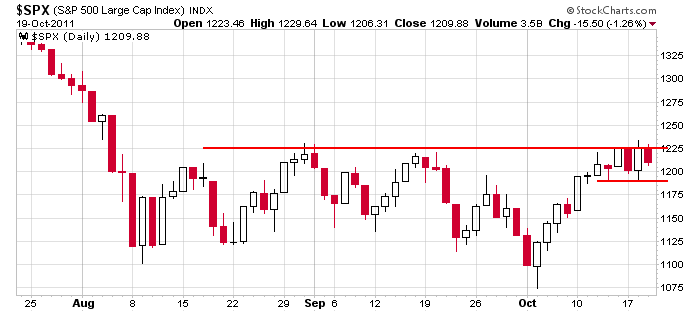
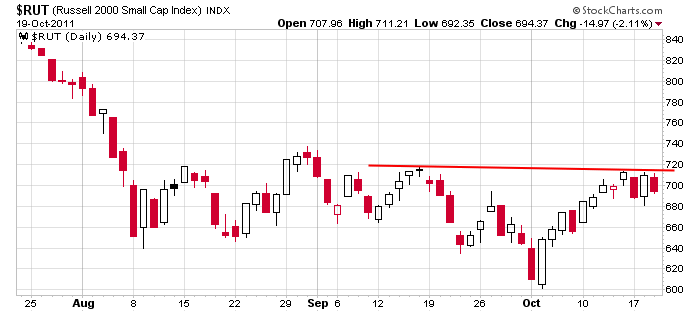
But this is still earnings season, the financial problems in Europe have not been solved and the indexes have only moved to the tops of their ranges. They haven’t broken out.
I favor the upside because that’s what the charts tell me my bias should be. But I’m on my toes. I have no problem recognizing when the market changes its mind. I don’t marry biases. More after the open.
headlines at Yahoo Finance
today’s upgrades/downgrades
this week’s Earnings
this week’s Economic Numbers
0 thoughts on “Before the Open (Oct 20)”
Leave a Reply
You must be logged in to post a comment.
Until the weekend, sunday, meeting for the EU finance folks when we may know something about the way the EU will go on debt management, this market is a leaf in the wind. The fact that yields are trending up on bonds says to me that some of the fear has resided, but at this point not sufficiently to go risk on. When is goes I will stick to the index leveraged ETFs and let things test out sentiment. Not looking for anything big.
I am excited over MSFT and Yahoo, the losers club is meeting again.Go! Steveo, you horses A.
Looks like 1200 is trying to hold. I don’t think it will.
Well,,,, I was wrong.
Geez! That was an eight point bar.
If SPX can’t get back above 1220 and we see a move below 1207 first, it sets up an interesting debate regarding whether we test 1191-1192 next before we can retest 1233 and the 50 day EMA at 1294ish.
Well, it looks like we are going up to 200 day SMA. I couldn’t believe at first, considering that all this recent rally was based on hopes only (mostly) on European crisis solution. Well, I though we may go down all the way to 1000 or 1050 level, but now it seems that since the market is literally “knocking” on the resistance at 1220-ish level and we may potentially break it and move higher in short term. However, look at VIX and once again rising volatility while the market is holding the level. It looks like a bearish sign. So we may witness an interesting trading in upcoming days. Overall we are still in bearish market and I still think that although we may rise up to 200 day SMA it will be a short term move and then we probably turn back down.
It looks like a coin-toss at the moment. Lots of breadth in the bars, but this pattern is looking like a bear flag to me.
No Comment (oxymoron)
It’s almost definite that your comment is clearly misunderstood by me.
Yesterday I said the fib 23.6 was at 1191 and the volume profile was at 1193. That’s my target. I’m currently short at 1207
If I’m seeing what I think I’m seeing, SPX would find support at 1109-1201 followed by a rally to the 1207-1217 area, a failure, and then a move down for the first critical test of 1191-1192. That’s the bearish side.
The bullish side is support shows up right in here (1198-1201) and we move up through 1220 to retest 1233-1234.
There’s enough room for me to go short with low risk on a failure at 1207-1217 with the expectation thereafter that 1198 won’t hold and 1191-1192 will be tested, at least.
I think we’re on the same page, but I don’t think it’ll test 1220 today.
I meant in the first sentence above, 1198 (not 1109).
It’s all about Europe right now and I’m sure the propoganda
spin doctors are doing a make up job on the whole thing as
we speak. HW
That’s seriously funny; the health of capitalistic America is dependent on the spin doctors of socialistic Europe.
Howard – I agree about the spin job attempts, but you can only spin for so long until the real facts can no longer be denied. The question is, how long? Not long! (stolen from MLK). That’s my thinking anyway.
Greece isn’t spinning; Athens is Aflame http://www.wealthwire.com/news/global/2079
The market should trend overall higher with the SPY potentially going to 135-136 area by year end.This will be a surprise to most investors. However, sometime next year a large downturn could bring us much, much lower.
jason,what target for SP500 will options sellers have tomorrow?
Good news or bad news from Europe could induce a 30 point move up or down, so it’s impossible to say where the S&P will be targeted. That’s too detailish for me anyways. I’d rather see the big picture and conclude the market is likely to go up slightly or down slightly etc without picking an exact level.
So, SPX finds anticiapted support at 1198ish and mounts a rally into the 1207-1217 targeted resistance area. It’s important to me now how this current pullback occurs. Down to 1204ish in an orderly fashion would be bullish to me and below 1204 in an impulsive manner would be bearish to me. If bearish, I’ll sell into a bounce. Otherwise, I stand aside.
The SPX bulls are no doubt looking for a bullish Head & Shoulders bottom pattern forming here that would project to 1234ish.
if it’s a H&S bottom, SPX broke the neckline and it’s on its way to 1234. However, I’m looking for a possible reversal arounfd 1218. If it occurs, it’ll make things interesting for both bulls & bears.
Retesting the neckline before the takeoff?
What time frame are you on? e.g. 60 day 1 minute.
I’ll sell on the close if SPX is below 1215.