Good morning. Happy Tuesday.
The Asian/Pacific markets closed mixed and perhaps with a bullish bias. Only Japan (down 1.3%) moved more than 1%. Europe is currently posting solid, across-the-board gains. France, Germany and Amsterdam are up more then 2%. Most of the other indexes are up more than 1%. Futures here in the States point towards a moderate gap up open for the cash market. On top of yesterday’s small gains, this will put the market at a 1-week high.
Technically the market remains in good shape. The indexes broke out two weeks ago from their Aug/Sept ranges, and after running a little higher, shifted into consolidation mode. There has been nothing wrong with the movement. The market isn’t going to go straight up uninterruptedly, so there should be no surprise we had a couple down days and some choppy trading. Absent news, odds favor the indexes legging up again, but we don’t live in a world that is absent news. Greece is moving over and Italy is now taking the top headline stories. In fact the first 4 stories listed on Yahoo Finance cover Italy. Here we go again. I continue to favor the upside, but being super aggressive isn’t wise because at any time, the market could gap down huge.
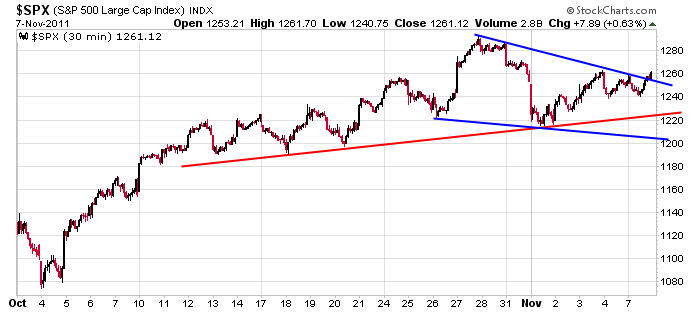
Here’s the 30-min SPX chart since early October. The trend remains up – albeit at a shallower slope – and we possibly have a falling wedge resolving up.

headlines at Yahoo Finance
today’s upgrades/downgrades
this week’s Earnings
this week’s Economic Numbers
0 thoughts on “Before the Open (Nov 8)”
Leave a Reply
You must be logged in to post a comment.
Looks like we have some stiff resistance in the SPX 1270 area. HW
spot on ,HW
even euro confirmed it
shorted the world bull about a hour ago
all well so far but the rising euro is a worry
SPX 1274 is the resistance area I was/am looking at and I hear what Jason is saying. For an intraday trade, I’m looking for a place to short, ideally on a bounce to 1268ish that fails, assuming the 10AM high holds this bounceback.
Well, that was fast. I’m short at 1265 with a stop loss at 1268, which I’ll drop to breakeven quickly if I don’t see more downside follow through.
Jason, I’m just looking for an edge.
You review Asia and Europe each morning, but never show a chart. Are the markets connected? Is there an edge? I’ve been watching the EUR/USD and ESZ1, they correlate and the EUR/USD appears to be more volatile. Also, I’ve been told, the NASDAQ leads the SPX and somehow the RUT figures in. Would it be helpful to list the correlations on an intraday/intraweek basis?
On a 1day/1minute comparison of the ESZ1 and EUR/USD the EUR/USD seemed to be playing catch-up to the ESZ1. Then the EUR/USD turned down and continued down while the ESZ1 went down then sideways. I Shorted the ESZ1 ten minutes before it went down. I’m not sure if the EUR/USD leads the ESZ1 or they just react to each other.
Just a thought.
there are many corrolations –to many to list
the german dax even sells the same apples as the ndx
imo the dax may have made a LH now and turned down
the ftse is the world large caps so has many dji,inc oils
its a full moon where i am and i can hear the wherewolfs crying,to warn us that there are some bears around
Well, I don’t see the any downside momentum so far in SPX, so I’ll cover at breakeven. If SPX falls gently into 1256-1260 first, I’ll probably get out there for a small profit.
It did it again. The EUR/USD showed weakness, I shorted the ESZ1 and five minutes later down goes the ESZ1. Damn! This is easy.
We seem to be meandering down, testing layers of support. Below SPX 1256 is a .618 retracement area (from yesterday’s afternoon low) around 1252-1253. I’m going to hold my short position and see if 1256-1260 can become resistance now.
EUR/USD 1d1m chart: From 10:00 ET it looks like a “W” pattern which should resolve up.
TF has been lagging badly last couple of days. Stocks usually tank when that happens.
kunta kinte – please clarify “TF” and expand your analysis. You have interesting comments, as always.
sorry PeteM, i forgot to mention. TF is the Russell 2000 futures contract. i don’t trade stocks, just futures and some options when i have an aggressive large one way trade. so TF has been lagging ES (SP500 futures), which usually ends up in a selloff. kind of a divergence trade.
We seem to have at least temporary support at SPX1255ish and I covered my short at 1257. If there’s a reversal pattern at 1260 or higher, I would consider another short position.
I like SPX 1263-1265 as a potential area for a reversal and intraday shorting opportunity
We had a failure in SPX just below 1263 and I’ll look for a bounce to find a place to try another short trade.
“M” pattern forming on the EUR/USD. ESZ1 should go up to 1270 then straight down.
The “M” pattern on the EUR/USD is morphing into a Bear Flag which should also resolve to the down side, but not as dramatic as the “M” resolution.