Good morning. Happy Friday.
The Asian/Pacific markets closed mostly up. South Korea gained almost 3%, and Australia and Hong Kong moved up about 1%. India dropped 1%. Europe is up across the board. Belgium, Germany, Norway and Stockholm are each up more than 1%. Futures here in the States point towards a moderate gap up open for the cash market.
It’s been a busy week. There’s been lots of news for the market to digest. We got strength Monday and Tuesday…extreme selling pressure Wednesday…a little strength Thursday. And through it all the indexes are holding in a consolidation pattern and down a small amount for the week. Here’s the 30-min SPX.
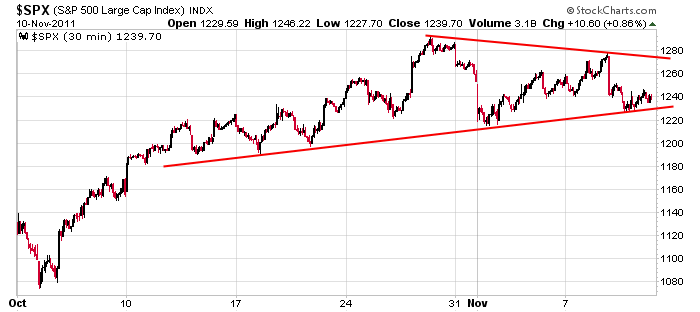
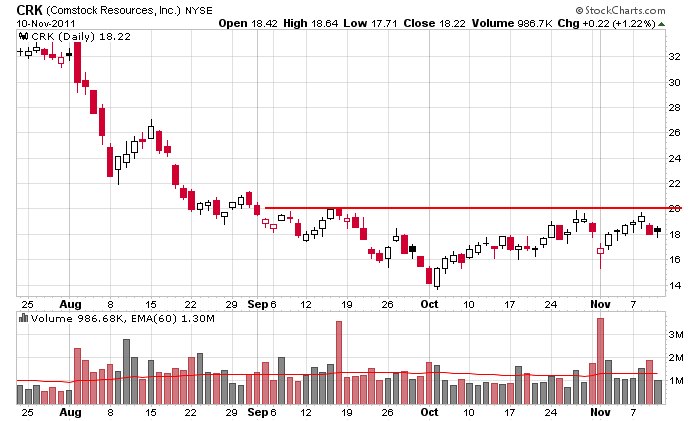
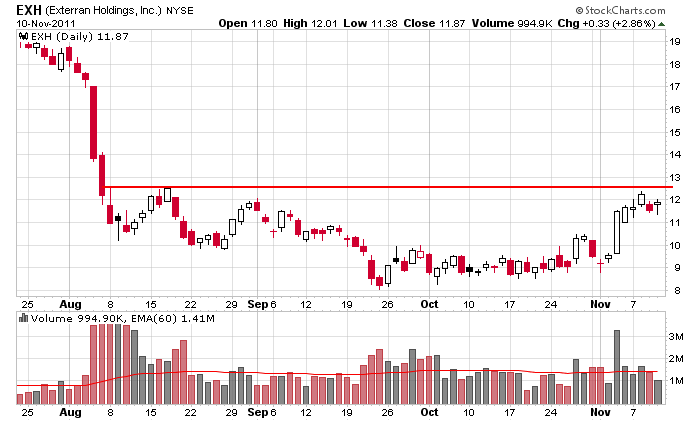
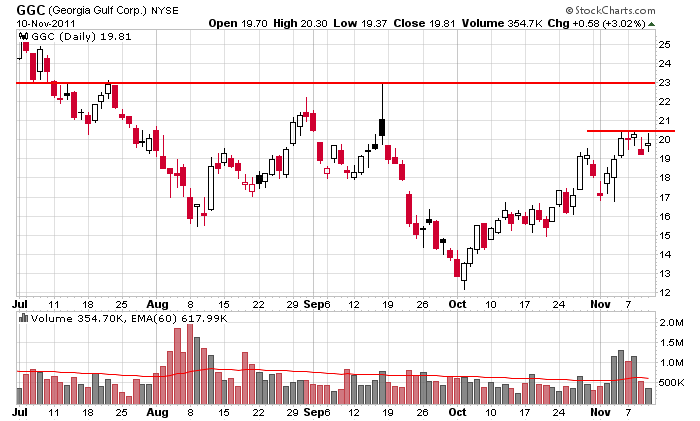
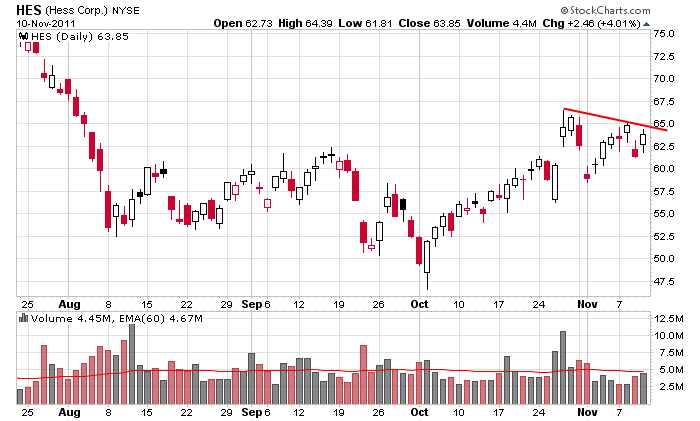
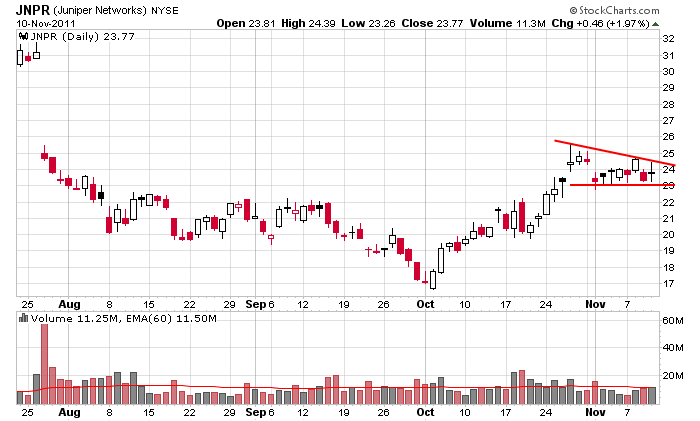
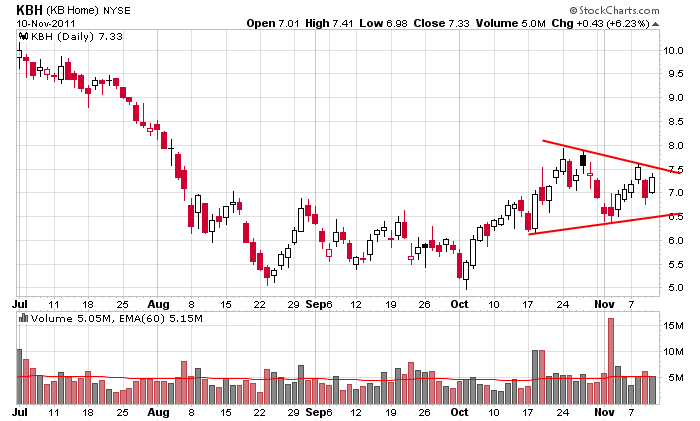
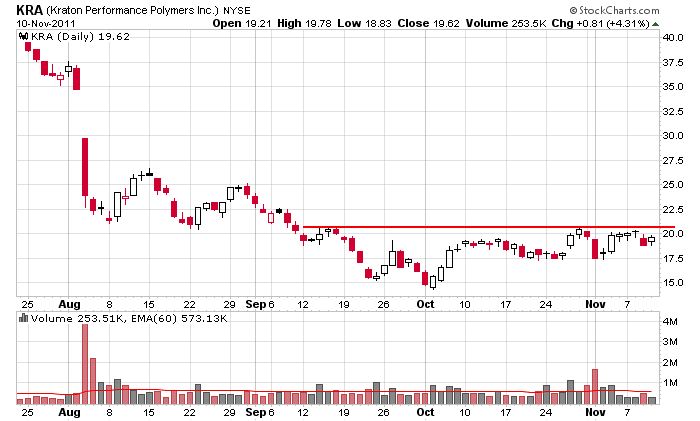
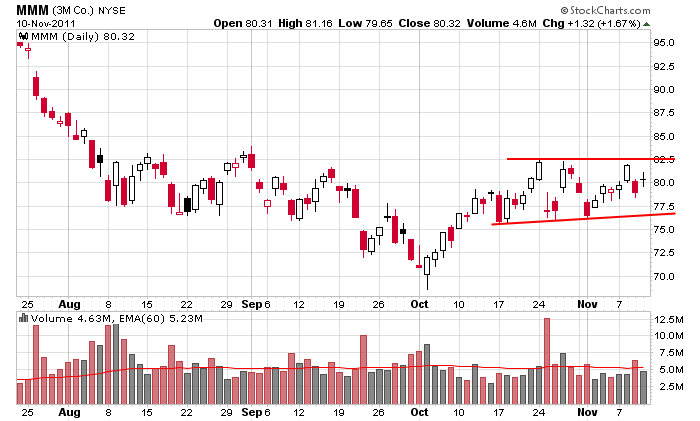
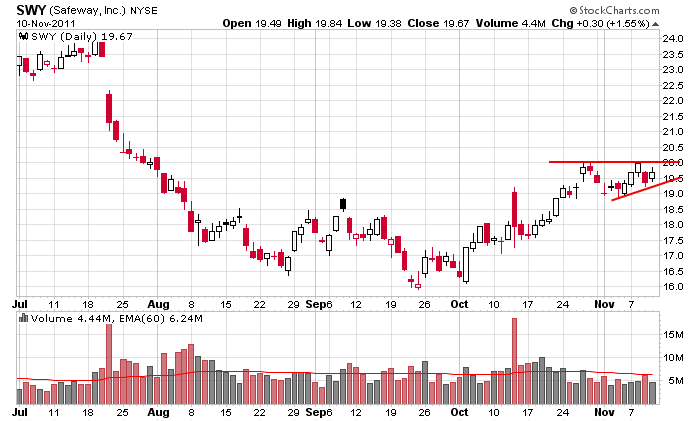
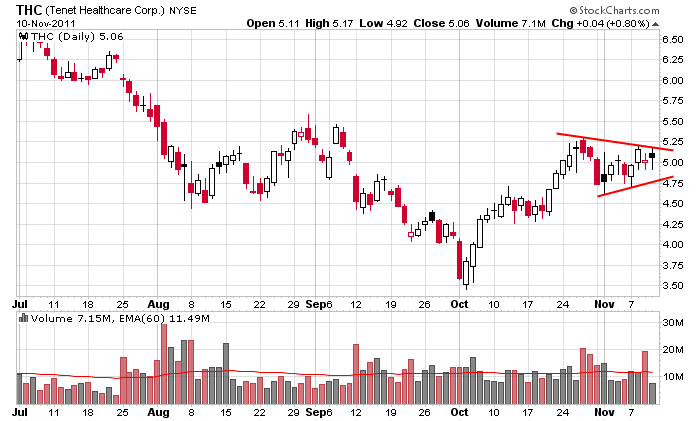
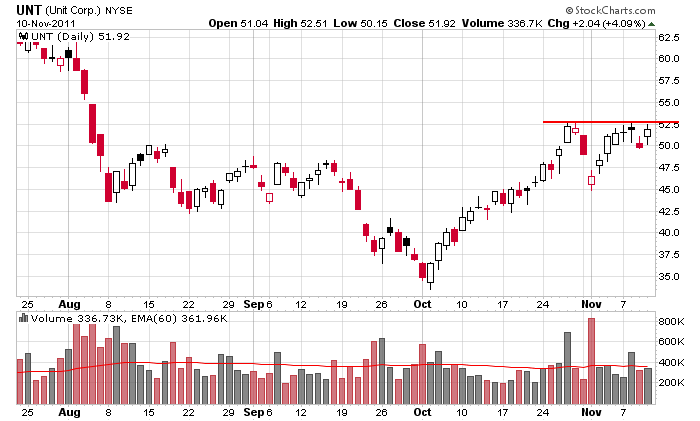
My sense is that there’s an invisible hand under the market…that if not for the financial situation in Europe, there’d be little doubt an end-of-year rally would play out. But Europe isn’t going away. Good news sparks buying; bad news selling. Over the last three weeks the market is flat. This by itself is bullish because given the horrendous news, the market should be down a bunch. The fact that it’s held up so well has to make you take notice. Maybe things do get worse in Europe and the October lows get tested. It’s always possible. But I wouldn’t get too bearish. if things are so bad, why hasn’t the market dropped yet? Here are a few charts to chew on. Have a good day. Enjoy your weekend.
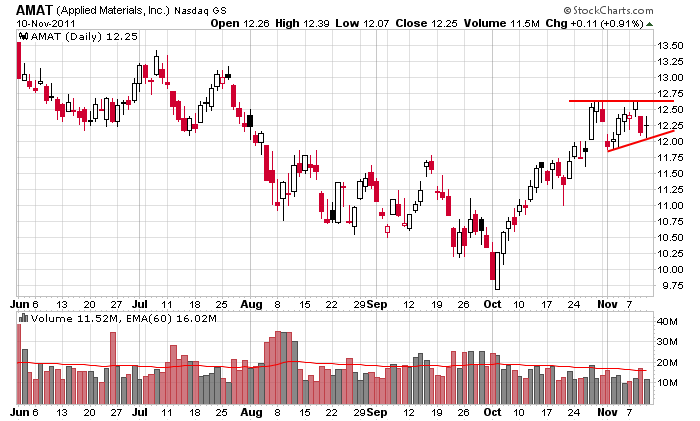
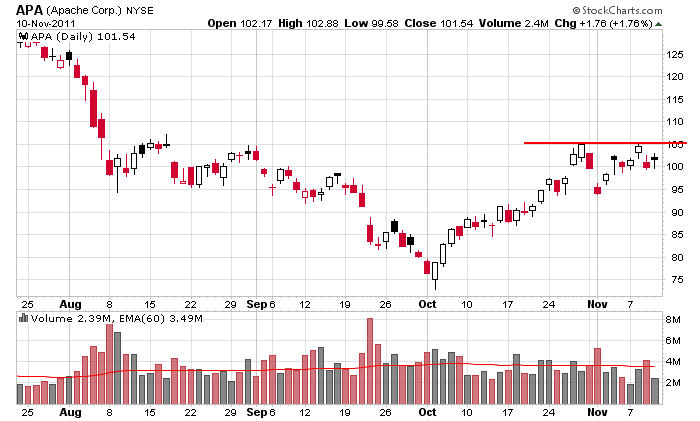
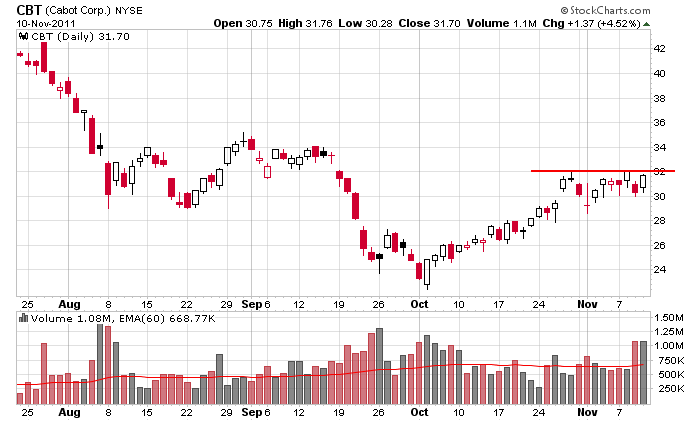
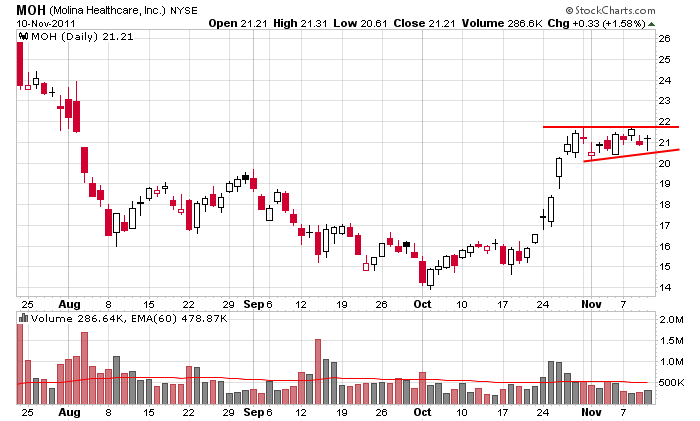
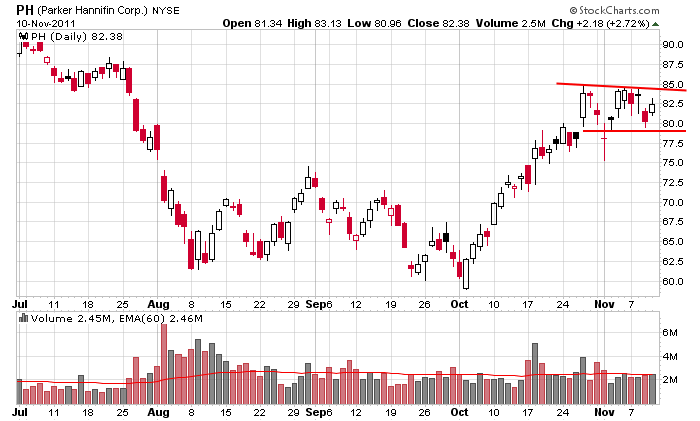
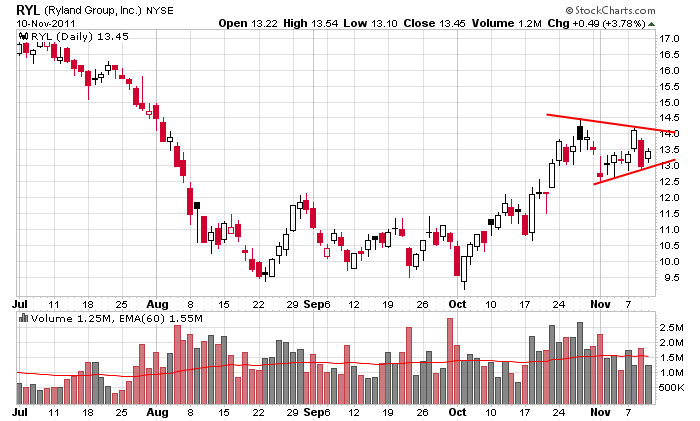
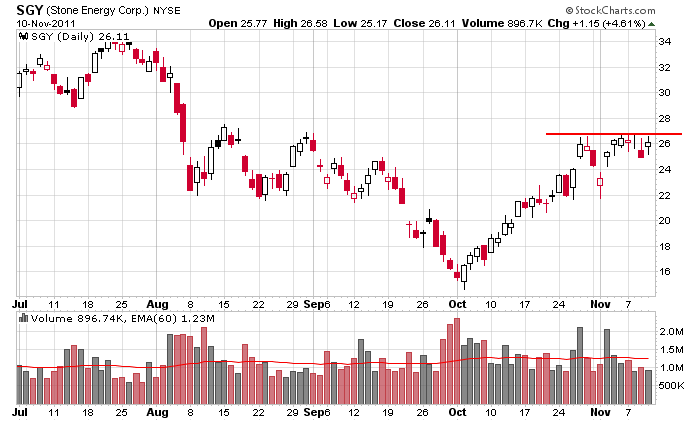
headlines at Yahoo Finance
today’s upgrades/downgrades
this week’s Earnings
this week’s Economic Numbers
0 thoughts on “Before the Open (Nov 11)”
Leave a Reply
You must be logged in to post a comment.
The invisible hand has now gone global. I guess when Tim Geithner went
over to Europe a few weeks ago he gave those Euro guys a first class
education in how to ramp up the markets by juicing the futures in
the overnight night hours. Works like a charm, doesn’t it? HW
The boys can not end the year down. The pressure to drive for a positive year is great. Will until the 23rd congressional report.
The Super Committee is not so super, in fact its a superbust : no agreement so far! So watch out for a major upset when the 23rd comes and goes and the default to across-the- board cuts becomes law, or will it? The smoke and mirrors are being passed out. The market may rally on the cuts only to regret it later. Thank God there are only 5 days a week for this nonsense.
up today/down tomorrow consolidation
the invisible hand is currency manipulation
the unthinkable that currencies can be manipulated has happened
central banks have found that working together they can prop up the euro
thus jucie the markets as high frequency traders equity computers are tuned to currency moves
up euro up shares
down euro down shares
one day the euro will be unsaveable–untill then its the day of the daytrader
“The Day of the Daytrader”, I think you’ve got a title for that song.
we may be having a trianglular moment
ill wait till the end of the day to short some bull
Interesting comments from everyone. I’m watching SPX 1255-1260 for a potential intraday failure. RicheE suggests I take quick profits. Hell, I’m having a problem taking an intraday day trade, never mind a scalp trade (LOL). But, maybe that’s what this has come down to until year end.
My theme here is that SPX may still need to go lower (say 1190-1215) before it tests 1290-1310. As long as I can find a low risk short entry and keep a close stop loss/breakeven I’ll live with the frustration of getting knocked out of a short trade. If SPX could get down to the lower level I mentioned, I’d look for a long entry for a year end rally. What happens if we go straight up to 1300+? I’ll be wrong and have missed the entire move from OCT, save a few long intraday trades along the way. Since I started this comment, we’re in the 1255-1260 zone. Let’s see what happens.
PeteM, I didn’t mean to scalp, I meant not to view your stops as one dimensional. I use stops as health insurance. I don’t want to collect on my health insurance because that means I’m sick. I don’t want to be stopped out. I don’t want my stops to tell me I was wrong. I want to know I was wrong before the stop. Yes, sometimes you get out early, but I’ve found, on average, it’s better to get out and back in than get stopped.
RichE – thanks for the insight. I think I understand what you’re saying and I’m going to keep that in mind, perhaps as early as today.
ndx and dji wants to break lower now but spx will prob hold things up till it hits intraday res 3 piviot at 1265
AussieJS – I have 1265 as a fibonacci resistance area. After that, I’ll look for your triangle as a possibility, i.e. 1272ish as “D” of the triangle.
For the past hour or so, SPX has traded between 1264-1266, which is right in my last fibonacci resistance zone before a test of this week’s high at 1277ish. Is this an intraday top forming or consolidation before a run 1277? Maybe we find out after 1PM. I hesitate to step in during the noon hour.
Flip a coin. I believe it will test the 10AM high before going higher or lower.
I’m short at SPX 1264 with a stop loss at 1267.
Thanks RichE- I got out of my short SPX quickly at breakeven rather than wait for my stop loss to be hit once I saw no downside follow through. To all, have a great weekend!
If QE3 was already in play, and nobody noticed, would there still be an invisible hand?
Taking a look at the two most recent Fed actions; sure looks like a closet QE3 to me.
First, in August, the Fed guaranteed 0% interest to its primary dealers for the next two years. The immediate reaction in the market was that the two year US Treasury dropped down to about a 0.2% interest rate. That’s a no-brainer. If you can borrow from the Fed for two years for a guaranteed 0% interest rate and then buy 2 year US Treasuries for a guaranteed 0.2% return, how much would you borrow and how much many of these Treasuries would you buy? Answer: All of them. Is there any wonder that upon the Fed announcement, within minutes, the 2 year rate had dropped by 0.25%?
Secondly, more recently the Fed announced Operation Twist whereas they’ll be selling $400B of short term Treasuries and buying $400B of long term Treasuries. At announcement, it was concluded by the media pundits that this would tighten the short term versus long term spread because the short term would go up in rates due to the Fed selling and the long term would go down due to the Fed buying. But this conclusion completely ignores the impact of the first Fed action, the guarantee of 0% for two years. Short term rates will not go up because the primary dealers will buy all that the Fed sells using 0% money borrowed from the Fed. Net-net, the short term stays flat and the long term comes down for an overall rate compression and overall lower rates. Due to Fed money printing to the primary dealers who are buying the short term Treasuries.
But who cares? The newly printed money, or its equivalent is staying at the Fed right? Therefore there is no inflation since the money isn’t escaping into the markets?
That’s what they’d like you to think. But just follow the money; you’ll see that it is escaping.
The primary dealer borrows newly printed money from the Fed, buys Treasuries with it, and deposits these Treasuries back with the Fed for collateral against the loan used to buy them. The Fed balance sheet has grown, but all of the growth is still locked up within the Fed due to the countering Treasury deposit.
But the Treasury isn’t cash…it’s a government IOU.
Going forward, the banks will be receiving interest on the IOU that doesn’t go into deposit with the Fed, but that’s only a small % of the money printed (~0.2%). (Which will be financed by additional money printing later on but that’s a different story.)
Following the dollars newly printed, you’ll see that they’re printed by the Fed, borrowed by the primary dealer, and then given to the US Treasuries in exchange for new Treasuries. Then, those newly printed dollars are spent by the Government…. Leaking into the market in the form of government worker pay, social security payments, medicare, contract payments, unemployment, pensions, etc.
You see, even though the Fed is playing games counting debt deposits as cash to make it look as if the dollars aren’t escaping, the reality is that it’s the government deficit spending which is leaking the newly printed dollars into the market. Because the Fed has set up policies intentionally geared to keeping rates low and newly printing money flowing to the US Treasury.
ESZ1 1d1m: is testing the 10AM high. It’s still a coin toss as to which way form hers. Most likely down.
The candle sticks Look bullish with long nicks. I think that’s called a giraffe.