Good morning. Happy Wednesday.
The Asian/Pacific markets closed mostly up. Taiwan rallied more than 4%, South Korea and India more than 3% and Australia and Singapore more than 2%. China dropped 1%. Europe currently leans to the downside, but there are no standout winners or losers. Amsterdam is up 1.2%; Belgium is down 1%. Futures here in the States point towards negative open for the cash market.
The dollar was weak overnight but is currently up. Oil and copper are down. Gold and silver are down.
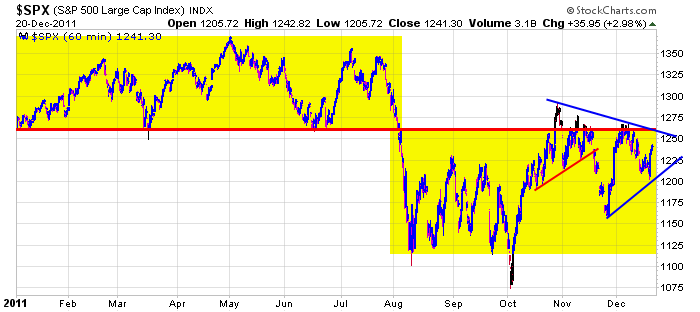
With yesterday’s bounce, the price action is starting to get compressed. The S&P has formed a lower high and higher low. If the market was permitted to act on its own without having to deal with news from Europe, this development would build energy into the market and increase the odds of an explosive breakout. But unfortunately this isn’t the case. The S&P can move through a significant trendline and get halted in its tracks by a surprise news headline. Here’s the S&P…

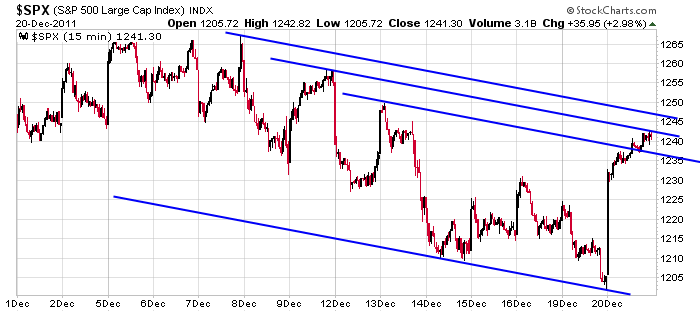
On a much shorter term basis, here are some levels I’m watching. On the upside, 1246ish; on the downside 1237. As of now the S&P will opened near my downside level. If prices can hold and move up, you know where my intraday upside target is.

headlines at Yahoo Finance
headlines at MarketWatch
today’s upgrades/downgrades
this week’s Earnings
this week’s Economic Numbers
0 thoughts on “Before the Open (Dec 21)”
Leave a Reply
You must be logged in to post a comment.
Please keep your insights coming Pete M. I’ve read a lot of ewavers on the web and your calls rank near the top. We have had a muddled mess of late but your wiggle counts have been ok and I know that’s not easy.
Chris – Thanks! So far today, SPX got to the first level of support and then bounced to just above the .618 retrace area from yesterday’s high to today’s low. Right now I’m treating this pullback from yesterday’s high as an anticipated 3 wave decline, i.e. today’s low is the first wave (small wave a) and this rally (small wave b) should be followed by another decline below today’s low (for wave c) to complete the wave 2 (or larger wave b)correction, ideally in the 1225 area+/-.
HOWEVER, if this bounce goes too far up (say above the open at 1241ish) then I’d have to think something differnt may be happening.
Hi there, yes folks there is a website I just found out about called
investimonials.com and Jason for what it’s worth, is in the top 10.
If yesterday completed EW wave 1 (or wave a) up from MON low, then the Fibo support areas for a wave 2 down (or wave b) correction would be 1233ish down to 1218ish. Interestingly (at least to me) the 10 & 20 day EMAs are at 1228 (also a Fibo .382 correction area)while the 50 day SMA sits at 1231 and the midpoint of the Bollinger Band is 1225. So, I’m looking for the potential for support in the 1225-1231 area and signs of an upside reversal to try the long side again.
If SPX 1239 to 1232+ continues as a trading range intraday, I’d treat it as being all part of smaller wave b from today’s low, with the implication that the sideways action would resolve downward (for small wave c) to a new intraday low this PM targeting the mid 1220s.
By the way, it seems most intraday swings have an uncanny way of finding support & resistance at .618 retrace levels. That reinforces my opinion that, from an EW perspective, we’re experiencing corrective 3 wave patterns both up & down. If, as I think, the longer term trend will resolve downward, we should begin to see more frequent impulsive 5 wave patterns to the downside even if they become part of a larger ABC downward pattern, e.g. 5-3-5 downside 3 wave patterns. That may sound confusing,so I’ll shut up.
imo–the reverse h/s -triangles-channels–abc’s in many a chart can be read many ways
none with confirmations
time for a xmas rally is running out and we are geting whipsawed for xmas on no vol
the ndx is violently ill today,but others are having a consolatation after y/days party
I decided to place a little bit of money on your initial support projections SPX sub 1231. With the NDX getting hammered, I decided to buy some TYH at 33.55
So far so good.
At 1:30PM, I’d want to see 1233, at least, broken on the downside to make me think the correction is still in progress with the mid 1220s as the target. If not, the correction I’m looking for could have ended at today’s SPX low.
If SPX reverses off of 1237-38 I’d get short for a potential retest of the day’s low.
so far todays dji/spx low on both cash and futures has been the main piviot point
so a bounce of that is normal and so far looks like a normal consolodation from y/days long range day
ndx but is still weak and a drag on its other 2 telepathic freinds–spx/dji
I’m short at 1237 and (as usual) I’ll cover quickly if there’s no downside acceleration.
I think AussieJS is on the mark about this bounce off the day’s low. I see nothing from an EW perspective that shows this rally from 1229ish that’s impulsive, which would confirm his take on “normal consolidation”.
I covered my short position at breakeven and I’m thinking the move down from yesterday’s high to today’s low completed wave a and the rally since the day’s low is wave b which can carry to or slighty above yesterday’s high of 1242ish. Wave c would then be expected to drop down to test or even exceed today’s low – resulting in and abc “flat correction. I’m looking at a 5 minute chart which shows a saw tooth, zig-zag pattern off the day’s low, which I’ll look to short again on any reversal pattern.
I nominate Chris for “Trader of the Day” for placing $$ on SPX at 1231 and TYH at 33.55. As for me, well, I’m still looking for the downside reversal!
I’m not brave enough to take a position overnight, but I’ll look at the short again after the open tomorrow provided there isn’t a dwonside gap on the open. Drinks are on Chris today!