Good morning. Happy Thursday.
The Asian/Pacific markets closed mostly down. China and Australia each dropped about 1%. Europe is currently almost entirely down. Austria is down 1.8%; Belgium is down 1%; France is down 0.9%. Futures here in the States point towards a negative open for the cash market.
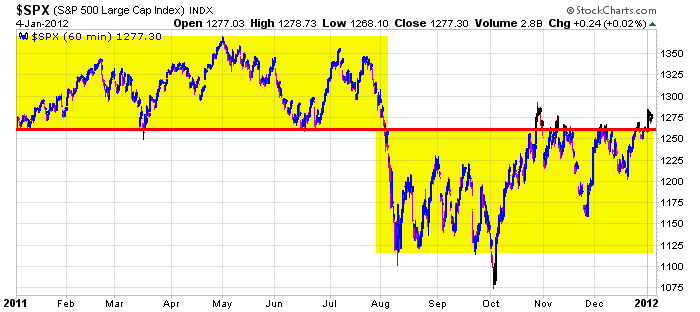
So far the S&P is up 19.7 this year, but Tuesday’s gap up was about 20 points. All the gains came in the form of a gap; since then it’s been mostly slow, range-bound movement. If you were hoping 2012 would bring a different character to the market, you’re still hoping. This is how the second half of 2011 was…lots of gaps, lots of boring, range-bound movement, lots of sudden moves that were hard to play.
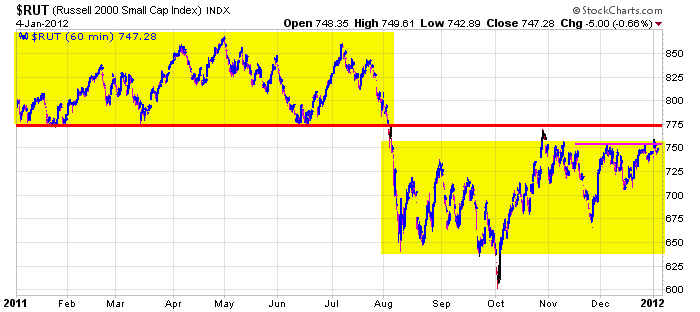
There are reasons to be bullish and reasons to be bearish. The index charts look decent – not fantastic – just decent. The group charts look good too. Many are trying to breakout, and they need to follow through. Individual stocks lean to the upside too. There are some laggards (ORCL, AMZN), but there are many more stocks doing great. The sum of this nudges me to the upside, but I’m still concerned the small caps are lagging. Below are the 60-min S&P and Russell charts. The S&P is back in its early-2011 range (although it still has some overhead resistance from late October to contend with), but the Russell has yet to recover to same degree. For me to believe a rally can have legs, the small caps must do better. Investors must be willing to take on some risk. Without the small caps, the upside for the large caps is limited. More after the open.


headlines at Yahoo Finance
headlines at MarketWatch
today’s upgrades/downgrades
this week’s Earnings
this week’s Economic Numbers
0 thoughts on “Before the Open (Jan 5)”
Leave a Reply
You must be logged in to post a comment.
Turbo Timmy and Uncle Ben love to gap it…. makes all the technicians think there is a break out happening
“All the gains came in the form of a gap”
A highly respected market particpant that I am familiar with has stopped publishing his quarterly newsletter. Said he’s not going to participate any longer in “broken markets.”
Those who have hung on to “their” idea of trading have not done well. They need to adjust to the market, not unlike a bowler who adjusts to the lane changes as the oil is redistributed. Momentum traders have taken big losses.
I like the higher lows since October. Along with consolidation at resistance, I am mildly bullish. Europe has been quiet. Any negativity from there will squelch the potential and keep things in a range. Any good news, and we break out. Either way, you can’t bet on it.
Watching and buying some charts that are bucking the trend or coming out of oversold.
ESH2: short @1270 >>>Love them Shooting Stars<<<
Jason; read an article that said the reason the markets, indexes, etc. are in sync is because of fear. When the news is bad everyone sells, when good everyone buys.
THAT WRITER HAS A FIRM GRASP OF THE OBVIOUS.
Yes, I see that now. My point; I think the markets in general are becoming emotional rather than technical driven. I’m having better luck with candles rather than trend lines.
RichE ???
You posted at 10:06 that you were short the ESH2 at 1270. I do not know what time zone you are in, but Jason’s website seems to be on EST and it shows your post at 10:06. The last time the ES was at 1270 was around 8:44 am EST.
Not that I disagree with your post regarding shooting star, but it just seems an odd time to post an entry.
Oh well.
I’ll try to be more timely. Acctually I was short an overnight from yesterday’s close. Currently short @1262.50 (underwater), but… volume low on this dip, hoping AKA the emotional daytrader.
Ah !!!
I am playing the one minute chart on the ES (never thought I would, but this trading environment seems to work).
Short at 9:32 CST at 1264.50,
Reverse & Long at 9:57 CST at 1263.25…and still long and easily the best trade so far today.
Using a combination of trendline, RSI, CCI and a very fast MACD set at 2,5,1 crossing the zero line.
Keep posting RichE and best of trading to you.
Out at a loss. This is looking like a W pattern. Target 1270.
with 5 min left to europe close–the dax and to lesser degree ftse are controling the markets via the ecb and the deuther bank–spelling
at midday control is turned over to usa inc change of currency centers to usa
if the fed enters miday it will be via euro ect
the russell is most vunerable today to program trades
im watching the ndx100 for a top and short
thats bad trading as the dji is the weakest today and the logical short
but if i do short i will be shorting the world inc dji
had a nice big world short at europe open
we have had a double intraday bottom on ftse and close near the bottom
thus the dji weakness
unlike the dax and ndx have managed to push up
short @ 1269.75
me too
I am out….1/4 point gain. Flat.
im waiting for ndx 100 to break under y/days high piviot
spx cash and futures are sitting at main piviot
dji still the weakest
Rats!
More rats! Still short.
Nice to see different names posting. I’ll try to be brief! Drawing a trendline on the SPX 60 minute chart connecting the LOWS since DEC 21st, shows 3 touch points (including today’s low) which,IMO, makes it of some significance in the short term. I’m looking for resistance and a reversal at 1276-78 to go short for a test of the 60 minute chart trendline support and a break that could to a further drop to 1263.
EW continues to talk in 3s – not 5s, so I agree that there’s no clearly defined trend. Good luck to all.
“no clearly defined trend”
Amen, Brother
still short, still underwater, still rats!
I am shooting for a short of EXH12 at 1276.5 for a quick trade. However, I think that is 1 of 5 of C of 2. Still more upside to complete C and consequently 2.
short at 1276.25
On the ESH2, I am waiting at a minimum for the CCI 20 to cross back below 0 on a 2 minute chart (unless some GREAT divergence appears). Otherwise, the market seems to be UP
Definitely looking up, sometimes I just try to skim off a little here and there. I’ve got a stop in place at 1280.26, as I hate it when it gets away from me.
Good luck to you Sir!
Thanks, CCI seems to be retreating. But, market still wants to climb.
now
ESH2 is riding the trendline that started at 9:54 CST. We are right at it now.
Even if it breaks, at this exact point in time, I see no reason to go short, but I would exit my long and go flat. That could change, but that is my position now.
the markets are being led by the ndx 100,with now have tick divergenge after a lot of up tick exstrems and the tick starting to move to neg–
we have r2 res for ndx cash and futures
res 1 piviot for spx
y/days high piviot for dji
short entry still unconfirmed but have stop
also now short dax /ftse futures which should be some free points for tomorrows open
todays insto target was ndx 2350 for opts strike before we go to ZERO
ESH2 I have exited at 1276.25 and am now flat. 1276.00 seems to be a line in the sand. Maybe sideways now, but when I have no clue I stand aside and wait for a clear entry.
And, I have to pick up my car at the repair shop. Not a bad day, 11.75 points.
Good trading to all !!!!
NDX100 at 2350 is a 786 fib retacement
and is a E for a overlapping sideways triangle
the tech bubble is over and i will eat apples
if it drops below 1273.25, I’ll drop my stop to 1273.75
Reading The Tea Leaves:
Packing it in still and making my last post:
I stated above that 1276 seemed to be a line in the sand on the 2 minute chart.
Sticking to the 2 minute chart,
At 1:14 CST it broke below that at 1275.75. The MACD (2,5,1), RSI (12 or 14), and the CCI 20, all broke either their 50 line or 0 line at that point.
That was a place to try a short.
And given some other negative divergences, it should really have fallen hard…but it has not.
Certainly enough to give me pause and stay on my toes. The exit is always up to the individual and the risk they are willing to take.
Y’all have a good day and Aussie…got any shrimp on the Barbie?
Yes, seems to be drifting. The last hour is always fun.
lowered stop to 1273.75