Good morning. Happy Wednesday.
The Asian/Pacific markets closed mixed. Australia rallied 2%; China dropped 1.4%. Europe is currently mostly down, but only Stockholm (down 1.1%) has moved more than 1%. Futures here in the States point towards a negative open for the cash market.
After 3 straight down days, the dollar is up. Oil closed at a new high yesterday but is down right now. Copper is pulling back. Gold and silver are both down.
The market started off the new year with a solid up day, but unfortunately for us traders, it wasn’t very playable because all the gains came at the open. The indexes then proceeded to close in the bottom half of its intraday range and below their open. The closing numbers were good, but the intraday movement was not.
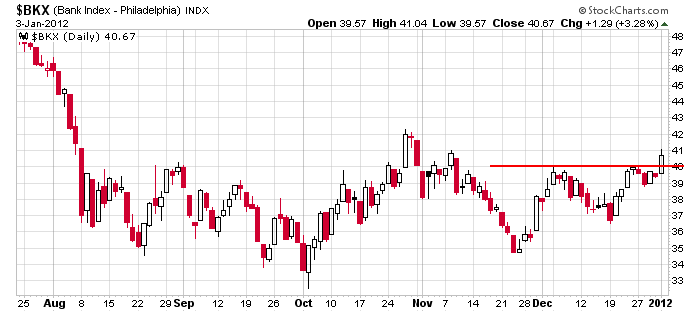
Several groups started the process of moving through resistance, but we need follow through and some separation. One day – especially a day where prices closed well of their highs – is not enough. Here’s $BKX – it’s one of the groups that could lend a big boost to the market if it can continue up.

Overall I’d classify the charts as being “constructive.” That means they’re not in bull mode, but they’re doing what they need to do to lean in that direction. Absent news, my bias in the near term leans to the upside, but until the indexes can put together a solid winning streak to crush the bears and change the psychology, I’ll be skeptical. More after the open.
headlines at Yahoo Finance
headlines at MarketWatch
today’s upgrades/downgrades
this week’s Earnings
this week’s Economic Numbers
0 thoughts on “Before the Open (Jan 4)”
Leave a Reply
You must be logged in to post a comment.
my dead cat –gruesome will do what he can to help the fed con those retailers
–so the instos can take the other side
“The indexes then proceeded to close in the bottom half of its intraday range and below their open.”
What indicator gives a read on where the close is in relation to it’s intraday range?
There is no indicator…at the end of the first hour, I mark the high and low. Then I visually note where price is relative to the FH high and low and the all-day high and low.
Putting EW analysis aside for the moment, I’m following the “kid with a ruler” using tendlines and Fibo relationships going back to SPX 1075 to see what I can find. Jason has already summed up the charts as “constructive”. I would agree and see the following trendline/Fibo related areas of upside interest: SPX 1292-1310; SPX 1325-1350; SPX 1375. As long as 1228-1258 holds on pullbacks, I wouldn’t scoff at a potential run to at least 1292-1310.
Getting back to EW, if you look at a 15 minute chart on SPX you can see 3 waves down completed (waves 1&3 are made up of smaller 5 wave sequences). We could now be in a 4th wave rally. As long as 1275.50 isn’t taken out before a lower low (which would then consititute a 5th wave down from 1284ish), we would expect a larger pullback is in progress with furter downside ahead. 1275.50 SPX is the key resistance hee, IMO.
Short ESH2. The EUR/USD isn’t agreeing.
SPX has the look and feel of 3 wave advances & declines both short & longer term. I note that the decline from 1284 to 1268 ended up being 3 down waves, which was confirmed when the rally from 1268 breached 1275.50. At the moment, wehave down trendline resistance at 1278ish coinciding with a .618 retrace of the move down from 1284 to 1268. I’d be interested in shorting a reversal here if it happens.
im short the world but will the naughty fed hold things up at the close