Good morning. Happy Tuesday.
The Asian/Pacific markets closed mostly up. Hong Kong, India and Taiwan each rallied more than 1%. Europe is currently up across the board. Austria, France, Germany, Amsterdam and Stockholm are up more than 1%. Futures here in the States point towards a moderate gap up open for the cash market.
The dollar is down. Oil and gas are up. Gold and silver are up.
Once again we got a sizable move down yesterday that got bought up. This has been commonplace the last six weeks. Dips get bought. Gap downs get bought. The bulls are resilient. As of now, today’s open will be near Friday’s close, so yesterday’s gap down and push lower will be completely recovered. Not only that. The market has dropped 4 of the last 5 days, yet the S&P has only lost about 2 points. Even when the bears have the upper hand, they aren’t able to completely take control.
Here are the S&P levels I’ll be watching/targeting today…
On the upside, 1318-1319 (approx today’s open)…then 1325…then 1329-1330.
On the downside, 1308-1309…then 1305…then 1298ish.

headlines at Yahoo Finance
headlines at MarketWatch
today’s upgrades/downgrades
this week’s Earnings
this week’s Economic Numbers
0 thoughts on “Before the Open (Jan 31)”
Leave a Reply
You must be logged in to post a comment.
Gap downs is incorrect. Gaps down is correct, and even sounds better.
The Gapdown trader sing this song,
Doo-da, Doo-da
The Gapdown chart five bars long
Oh, de doo-da day
AussJ Goin’ to trade all night
AussJ Goin’ to trade all day
I bet my money on a long-tailed candle stag
my broker margined me away
Follow the Feds http://www.ritholtz.com/blog/2012/01/living-in-a-qe-world/
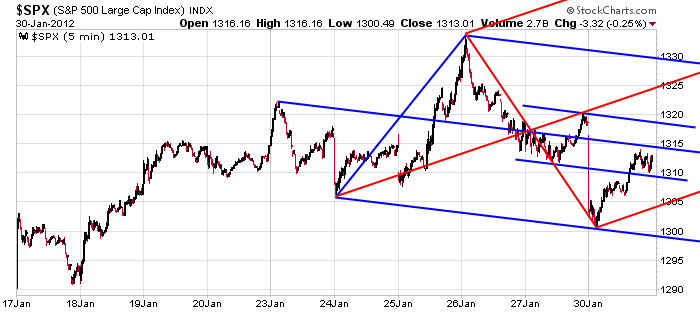
Jason’s pitchfork resistance, and a broken trendline retest area coincide around 1325+/-. Yesterday’s rally off the SPX 1300 low has a 3 wave look, IMO, so we could be looking at wave “b” of an abc correction or wave “b” of an abcde triangle with wave “b” ending in the 1324-1326 area. Depending on your trading time frame, a reversal in this area may be a low risk short position with a close stop loss.
Look for pullbacks
Look to china & latin america not just the us
potential reversal week
Its been a good run, if we brk yesterdays low pick your favorite retracement fib.
Raymond – I hear you. In SPX, the .500 retrace I’m looking at is 1292 and the .618 is 1280ish. If we’ve completed wave “a” at 1300 and wave “b” at 1321+, then wave “c” + wave “a” at around 1288 – all from an EW perspective, that is.
I meant wave c = wave a at around 1288.
The pullback from yesterday’s low to today’s high so far is a .618 retrace. The rally from yesterday’s low to today’s high reversed this morning just above the .618 retrace of the move down from SPX 1333 to 1300. Since the 1333 high, we appear to be moving up and down in 3 wave patterns,IMO. If SPX climbs above 1317 after this AM drop to 1308, we could see 1324-1326 tested.
Still pockets of strength. Regardless closed the rest of my IRE NBG
Mrkt direction dcsn after dax close in 30m imho
Should show who is being bought, who is being sold
as a 24 hour gambler the market picture is different than shown on the cash charts
nither bull nor bear is in charge but the big instos that are going through a complete realignment of shares/bonds/indexes/futures–call it a distribution -topping move or what ever–the moves down are impulsive with corrective ups to higher highs in the asian/europe session—this is world wide and looks more like instos getting long term set at certain strikes—-oh well its end of month begining ect
Liked ur song RichE—imo its the 3 swing shuffle—asia /europe/usa
it may be 3-4 days before the bears take control
but the snipper scalpers are in control always
follow the euro that holds the key to the carry trade
amazon /cisco ect gamblers after the bell to set the tone for asia
and greace/portugal bond gamlers still in focus
Jason,
looks like u have drawn a head /shoulders on ur chart
You’re welcome Aus.
I’m short the close with overnight target 1300.25.
The rebalance makes since. When will they be done? Do they generally sell first to drive the market down then buy to drive the market up?
A pullback of substance perhaps. China news will be the catalyst.
Time to be patient.
The Nasdaq100 is the key http://finviz.com/futures_charts.ashx?t=NQ&p=w1
Monitor the wkly daily & hrly.
All the best.
And having gone through my watch lists and screens tonight it looks like the bulls are still alive and well. Unfortunately the indices loaded with fat has beens.
No one said trading is easy, Ken Fisher calls the market TGH – the great humiliator.