Good morning. Happy Wednesday.
The Asian/Pacific markets closed mostly down. Japan dropped more than 2%; Indonesia, Singapore, South Korea and Taiwan dropped more than 1%. Europe is currently down across the board. Stockholm is down 2.5%, and Belgium, France, Germany, Amsterdam, Norway and London are down more than 1%. Futures here in the States point towards a big gap down for the cash market.
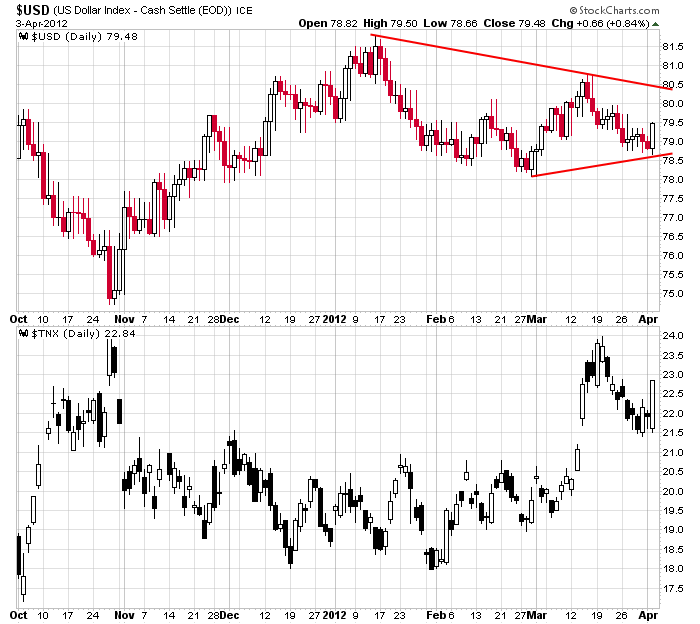
The dollar is up. Oil and copper are down. Gold and silver are down a bunch.
The big news yesterday was the FOMC minutes. They were more hawkish than anticipated so it’s thought the odds of QE3 have declined. The news rallied the dollar and interest rates (see below) and put pressure on commodities.

It’s pretty sad that Wall St. is so addicted to the Fed’s easy money policy that any hint of the punch bowl being taken away is reason to run for the hills.
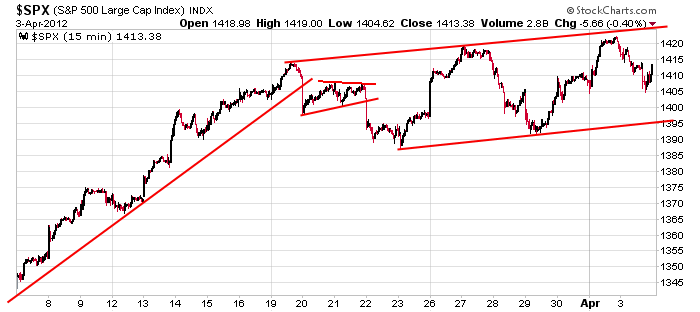
Here’s the 15-min S&P 500 chart. I’ve been neutral for a week and anticipating this range to continue through Friday’s employment report and possibly into the beginning of earnings season.

Play good defense out there. Don’t be a hero while the market rests.
headlines at Yahoo Finance
headlines at MarketWatch
today’s upgrades/downgrades
this week’s Earnings
this week’s Economic Numbers
0 thoughts on “Before the Open (Apr 4)”
Leave a Reply
You must be logged in to post a comment.
Hey Pete, Good finds and great additions to the wine cellar. I’m liking the pattern beginning on 3/19. IMO, a break of the lower short term trend line beginning on 3/23 provides an opportunity for pattern clarification. I expect it to hold and one more rally to the 1426 area. Now seems to be a low risk point to go long for a near 30 pt rally. However, a break of that line gives me a target of 1340.
Brian – the short term trend line you mention intersects now with the trendline from the late NOV/mid DEC lows connecting the 1340 MAR low. If today’s low holds and reverses, we could yet see your 1426 or my 1440 target. Regardless, IMO, we’re seeing a price & time toppng formation either completed MON or to be completed soon. Further weakness into the close, leaving the 20 day EMA (1397ish) behind could/should trigger a test of 1370-1378 down to your 1340 target. This is an interesting day and week setting up, as the employment numbers come out FRI when the market is closed. I’ve noticed that the latest economic reports are starting to miss expectations (as the leading indicators were suggesting recently). Will employment numbers & earnings season disappoint as well?
Pete..when u are talking about a price & time topping formation that u see unfolding, what are your current expectations for how durable a top or how far the eventual correction may be?
I’m assuming that u expect a much bigger decline than SPX 1340.
Thanks
Chris
Chris – I think a topping formation in this time frame is suggesting an intermediate top at least, which has the potential to be a long term top that ends the cyclical bull market that began in MAR’09. But, first things first, i.e. assuming a break below SPX 1340, I’d have to see 1292 broken and more importantly the 80 week SMA at 1272 (and rising)broken and then become resistance to think the cyclical bull market may be over.
Right now, we have nothing but a test of important short term support at the 20 day EMA. I think Brian is right that 1340 is key support with a test of 1370-1378 quickly if we start trading below the 20 day EMA. From an EW perspective, the down move so far could be a developing 5 wave sequence which would be bearish but, IMO, I don’t see it yet.
there has been no negative tick extsream readings today sofar like y/day
suggesting todays sell off although deepish is more controled than panic
the close could be interesting
ESM12: Tight stops. I don’t think it’ll go down anymore.
Looks like embarrassment to me. Someone said you can’t do that and someone did it to embarrass them.