Good morning. Happy Tuesday.
The Asian/Pacific markets closed mixed. Hong Kong was the only 1% mover – it dropped 1.2%. Europe is currently down across the board. Amsterdam is down 2%; Austria, France, Germany, Norway, Stockholm, Switzerland and London are down 1% or more. Futures here in the States point towards a flat-to-slightly up open for the cash market.
The US dollar is flat. Oil is down; copper is up. Gold and silver are up.
The market has now had a long weekend and an entire trading day to react to Friday’s employment numbers. This makes today important. Was yesterday an over-reaction or was it just the beginning? We’ll see. I’ve had a defensive posture for a couple weeks, and I see no reason to change.
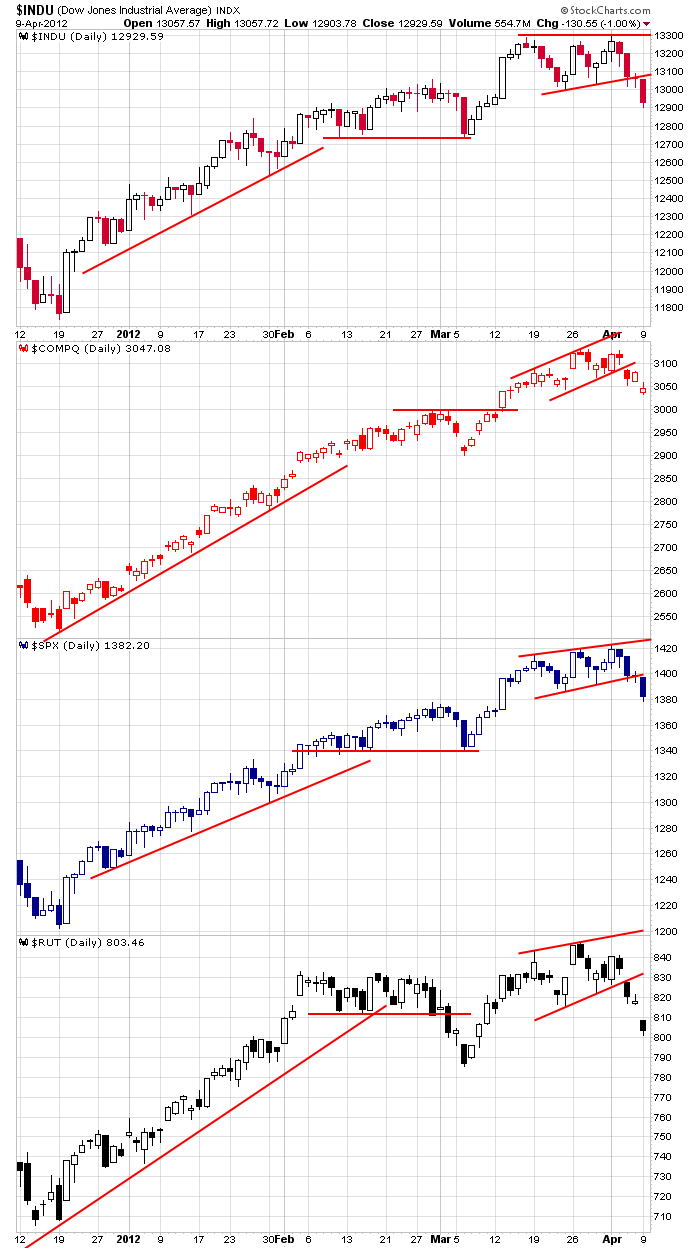
Here are the daily index charts. All of them have clearly broken down from rising patterns. This doesn’t automatically mean a downtrend is underway. It just means the uptrend has been neutralized in the near term. The market could now either move down or move sideways in a bigger range.

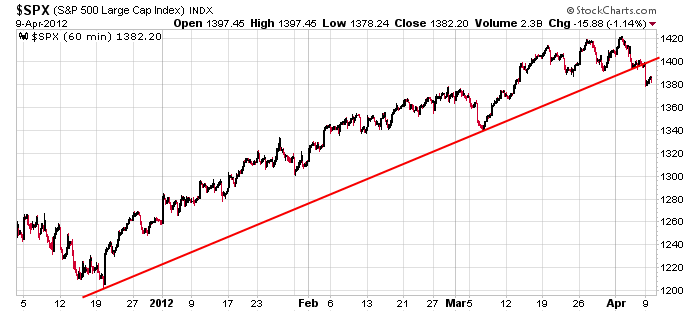
Here’s the 60-min S&P chart. It shows a longer term trendline being broken, but in my opinion, as stated above, this just means the uptrend is in jeopardy. It’s very possible the market trends down right now. It’s also very possible the market moves sideways in a range. A broken trendline doesn’t automatically mean the market is going to fall apart. Ask the bears; they’ve been wrong so many times the last three years.

Be defensive. The near term is unclear.
headlines at Yahoo Finance
headlines at MarketWatch
today’s upgrades/downgrades
this week’s Earnings
this week’s Economic Numbers
0 thoughts on “Before the Open (Apr 10)”
Leave a Reply
You must be logged in to post a comment.
And here comes “better than expected” earnings season….
Yo, Brian! From an EW perspective, RUT is showing a clear pattern of 5 wave downward structures on the hourly chart. We appear to be in wave 3 down approaching important support at 785. The important trendline from the Oct low has been decisively broken. If this is going to be a corrective 3 wave decline, 785 should hold. If it’s going to evolve into a 5 wave decline, 785 will only be temporary support and then it will be broken and 770 would be a logical target, IMO. I’m focused on RUT because I think it’s the leading index – both up & down.
What are you seeing?
Hey Pete, I concur. If this is only a correction, 785 would have been the target. We’ll see how things behave when it gets there. I’ll be fully committed to a trend change if 752 is reached.
the bears say—this does not feel like the start of a wounderous bear affair,
so far but we could be wrong
AA dropped through 9.50, went to 9.45 and came back both yesterday and again today. ran to 9.54 and sat there like a whore waiting for suckers to buy. then fell back through to 9.46. this market has no integrity no honor. those days are long gone. it’s all deceit and stinks like a pile of crap
europe selling off for their last half hour,with a impressive usa tick exstream
any truth in the rumour about apple being in merger/acquesition mode
I said yesterday cnbc sounded like they had been told to warn us about this iminent pullback
markets pushin pretty hard. acts like it wants to see 3000
Note the bottom last month was exactly 2900
GOD nothing feels like freedom after being locked up for three months
10y yield under 2%, 30y fast approaching 3%. both are only 30-40 bps away from multi-decade lows. what a sweet spot bonds are at. if fed does qe, it perks up the bonds. if it doesn’t, economy tanks again and bond yields tank with it. if middle east, north africa or southern asia explodes, bonds explode with them. 3% 30-year mortgage coming soon to a theatre near you?
kunta kinte – my feeling as well. I’ve been putting clients in TLT and PLW when the 10 yr treaury gets above 2% and the 30 year above 3% for about a year now and it’s worked well.
as i shared at the beginning of the quarter, i am expecting a sideways to slightly up bond market until the end of june, not a raging one. i would buy dips but i wouldn’t chase rallies. and i would definitely lighten up at the rips.
at least ur yeilds are not inverted—–yet
but how weak is usa that it can only afford 3% mortgages
real economies enjoy 7$
insto selling today and a impulsive affair could develop–ndx seems to be picking up downside beauty
1340 looks like a target
so higher the mortgage rates, stronger an economy? does that mean contries with 50% or 100% mortgage rates are the strongest, economically most prosperous ones? if so, i happen to know a few of those..
i wish running a real economy was as easy as 23 million people digging up coal and copper and iron ore and selling it to the chinese. the way coal prices have been coming down lately, i wouldn’t brag about even that though..
money follows yeild–normal yeild
zero yeild is no good for anyone
Looking at NDX longer term on a monthly chart going back to calendar year 2000, you can see that from the 2002 low, the first rally retraced to Fibo .382 into its 2007 peak and, after the 2009 low, it has now managed to retrace to Fibo .500 at its recent high. It would seem to me that NDX will not be able to go much higher than its recent peak of 2795 (unless it’s already peaked at 2795) without undergoing a meaningfull pullback first to reset itself before attempting to achieve the Fibo .618 level around 3250, assuming the rally from 2009 is not over. The band of support from 2400 down to 2000 would be a reasonable longer term downside target, IMO.
try measuring fibs from where the 200dma crosses the market. it will call a top
looks like we can call 3000 good for the day
I think this may be a test to see where the real buyers come in and where the real market may stabalize. A test run to formulate a strategy for when twist expires in june. cross your fingers this drunken pig can walk
AA earnings report in three hrs. have shares in one hand cash in the other
just heard the bernank will not allow the market to drop more than 10% from the high
santorum just started off by saying “lets pray” I replied “thank God you’re out!”
ES: At least 1525 by Oct. or Obama won’t be re-elected.
who you going to put in? a mormon. they worship satan for showing them they are gods
Who am I going to put into office? You honor me. I couldn’t even fix the election date.
With the exception of NDX (waiting on PCLN & AAPL to break?), all the major indices are below their 50 day EMAs. Daily technical indicators are on sell signals but soon to be at oversold levels.
RUT may be completing a 3rd wave down at 785 (unless it’s in a wave 3 extension) with the question yet to be answered, i.e. will the down move from the 848 high unfold in a corrective 3 wave pattern or an impulsive 5 wave pattern as far as the near term is concerned?
I read where some timing models are expecting some sort of turning point (a low?) this week/early next week.
well that explains why they let it come down. AA up 6% after the close. dip over