I’m two days late with this report. Oh well. Options expire this Friday, so let’s take a look at the open-interest on SPY, DIA, QQQ and IWM to see if they hint at movement the rest of the week. Here’s the theory: the market conspires to cause the most pain, to cause the most number of people to lose the most amount of money. If the market is to accomplish this, what does it need to do this week?
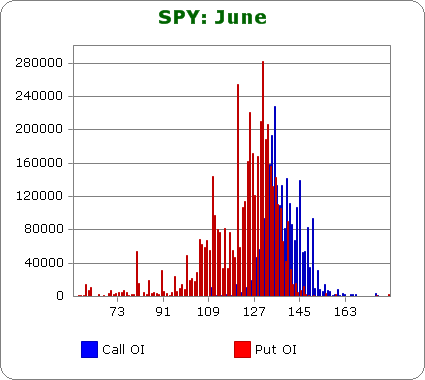
SPY (closed 132.07)

Puts out-number calls 1.9-to-1.0 – slightly less bearish than last month.
Call OI is highest at 135 and is pretty solid down to 130 and up to 145.
Put OI is highest at 130 and is solid down to 120 (with a curious spike at 110) and up to 137.
There’s overlap between 130 and 137 – a big range. A close within the range would cause lots of pain, but since puts out-number call, a close in the upper half the range would be ideal. Today’s close was at 132.07, so a move up is needed.
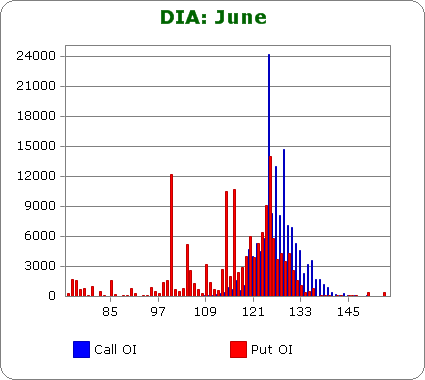
DIA (closed 124.89)

Puts out-number calls 1.3-to-1.0 – more bearish than last month.
Call OI is highest 125, 127 and 128.
Put OI is highest at 124 and 125, and then there are spikes at 114 and 116.
There’s some overlap at 125, so if the stock closes there, max pain, or something close to it, will be felt. With today’s close at 124.89, DIA is already there, so flat trading the rest of the week is needed.
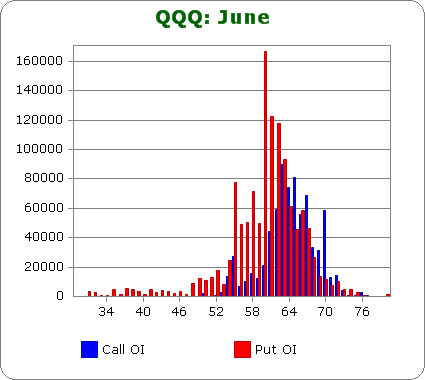
QQQ (closed 62.13)

Puts out-number calls 2.3-to-1.0 – much more bearish than last month.
Call OI is highest between 62 and 67 with 63 being the strike with the highest OI.
Put OI is highest between 55 and 67 with noticeable spikes at 60, 61, 62 and 63.
There’s overlap between 62 and 67, but a clearer picture is seen via highest OI strikes (60, 61, 62, 63 for puts, 63 for calls). A close at 63 would expire all these options worthless. Today’s close was at 62.13 – close enough. Flat trading or a slight move up would do the trick.
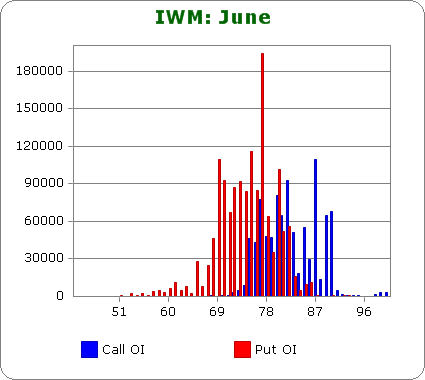
IWM (closed 75.34)

Puts out-number calls 1.9-to-1.0 – the same bearishness as last month.
Call OI is sloppy and sporadic. The block between 75 and 90 is noticable, but within that range, there are very high prints and very low prints.
Put OI is more steady. Its block lies between 69 and 80 wth its highest spike being 77.
There’s overlap between 75 and 80. A lot of pain will be felt in the middle of the range and above 77. Today’s close was at 75.34, so a small move up is needed.
Overall Conclusion: There was no pattern with this month’s numbers relative to last. QQQ was more bearish while SPY was slightly less bearish and IWM was about the same. But the position of the market relative to where it needs to be to cause max pain is the same regardless of which ETF you study. In all cases, flat or slightly up movement is needed. The market only has two more days, but it doesn’t have to go far.
0 thoughts on “Using Put/Call Open-Interest to Predict the Rest of the Week”
Leave a Reply
You must be logged in to post a comment.
How do you differentiate between sold (puts and calls) and bought (puts and calls)?
It appears you are looking at the data from a buyers perspective not a sellers perspective. Am I correct or am I misunderstanding something.
You are right. Retail traders buy options, the pros sell them. When they expire worthless, the pros win and retail loses.
and as it comes to pass,there are 2 charts—-one for retailer opts participation and one for big boy insto participation and when both are at opposing extremes ,we get big market moves
and thats the only reason the market moves